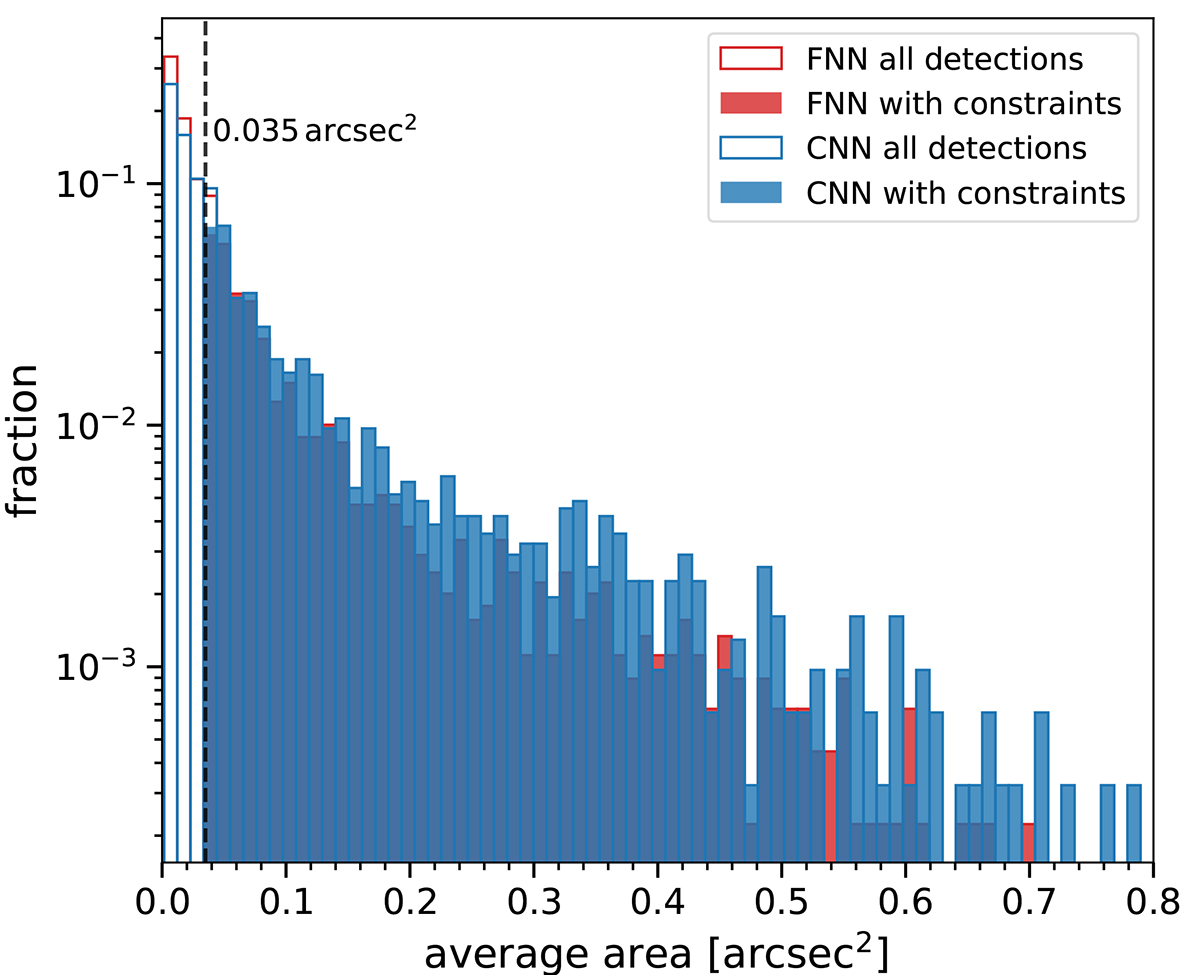
Fig. 6.
Download original image
Histograms of the area of EB predictions in the new dataset by the CNN and FNN models, using a probability of 0.5. Red bars correspond to the detections made by the FNN model and blue bars to the CNN model. Filled bars represent the area of EBs that meet the size criteria explained in the text. Dark blue color represents the overlap between red and blue bars. Unfilled bars show all the detected EBs, without size constraints. The dashed line marks the area cutoff used in the criteria. The y-axis presents the fraction of each bin with respect to the total number of detections. For clarity, the x-axis is limited to 0.80, although the histogram tails extend up to approximately 1.2 arcsec2 with near-zero counts.
Current usage metrics show cumulative count of Article Views (full-text article views including HTML views, PDF and ePub downloads, according to the available data) and Abstracts Views on Vision4Press platform.
Data correspond to usage on the plateform after 2015. The current usage metrics is available 48-96 hours after online publication and is updated daily on week days.
Initial download of the metrics may take a while.