Fig. 5.
Download original image
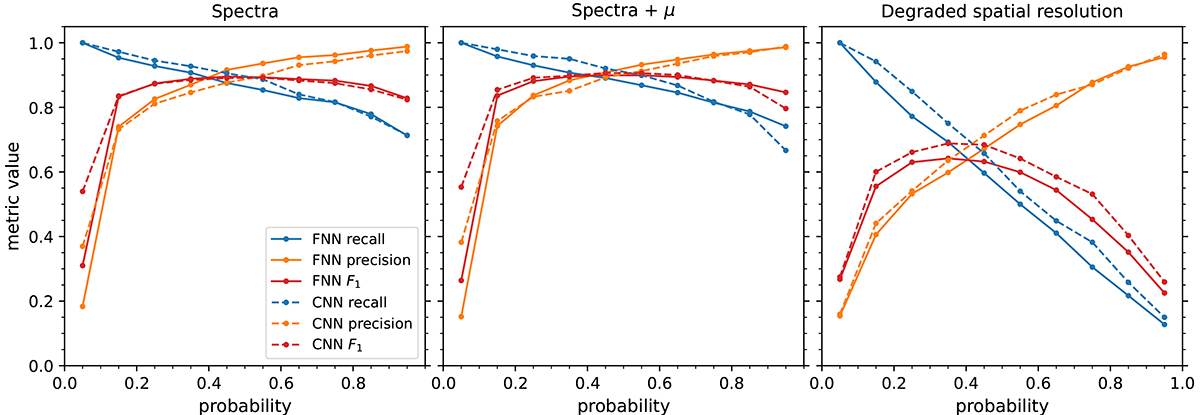
Metrics of recall, precision, and their harmonic mean, the F1 score, for the models trained to perform EB detection in SST Hα observations. The metric scores are shown as a function of probability of a detection being an EB. From left to right, the metrics are for models trained using: all the spectral points, all spectral points plus μ, and all spectral points for the spatially degraded dataset. Dashed lines represent CNN models, while solid lines indicate FNN models. Blue, orange, and red colors correspond to recall, precision, and F1 score, respectively. These metrics have been computed using the test set.
Current usage metrics show cumulative count of Article Views (full-text article views including HTML views, PDF and ePub downloads, according to the available data) and Abstracts Views on Vision4Press platform.
Data correspond to usage on the plateform after 2015. The current usage metrics is available 48-96 hours after online publication and is updated daily on week days.
Initial download of the metrics may take a while.