Fig. 2.
Download original image
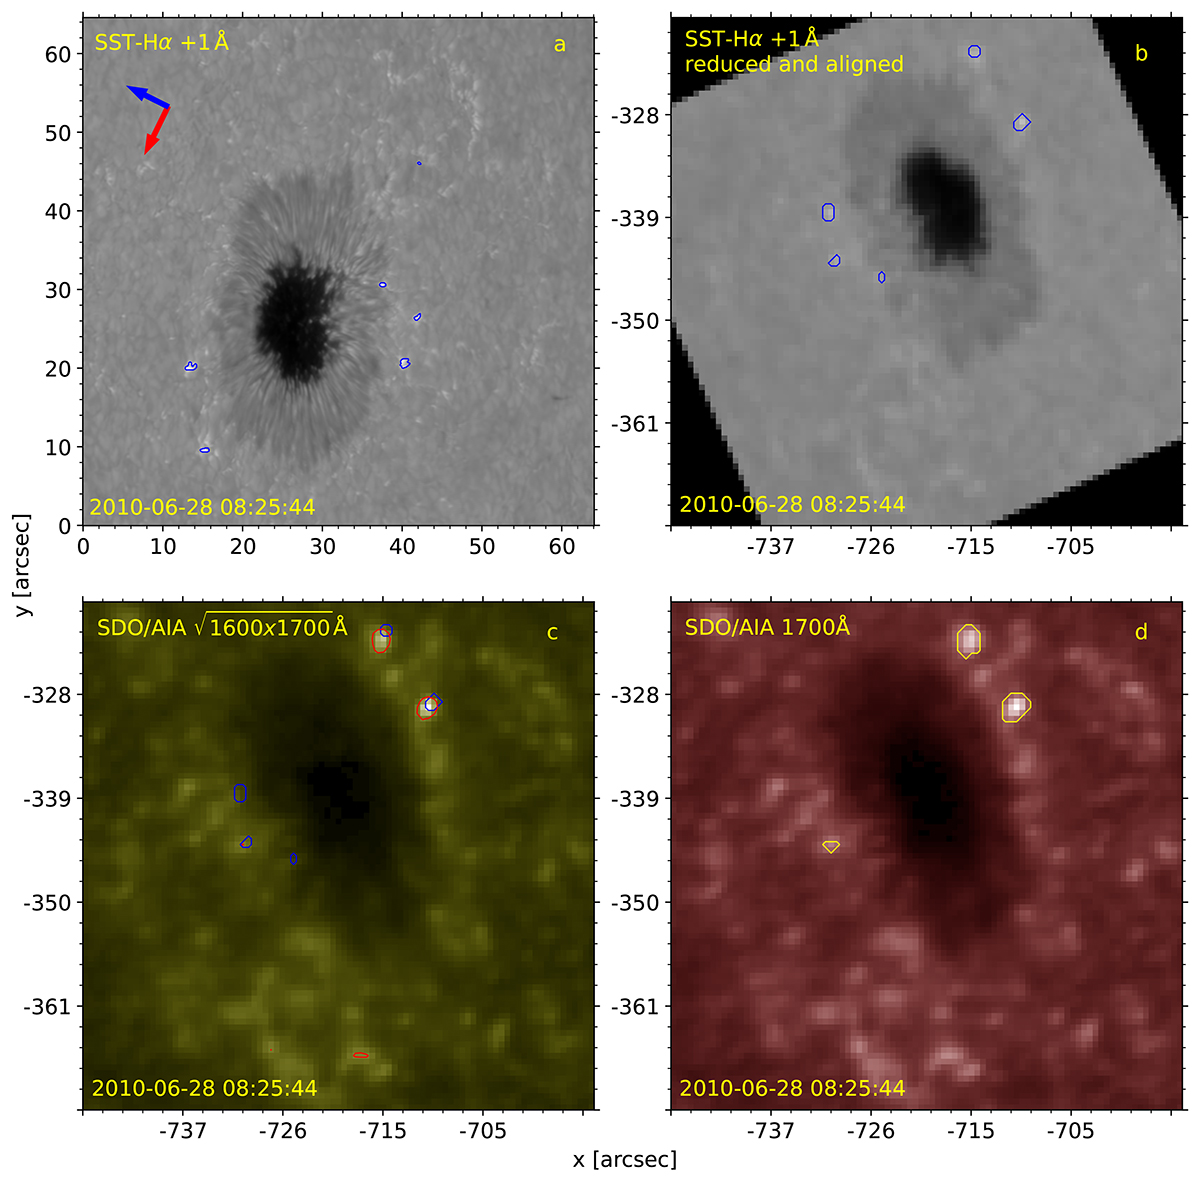
Illustration of the process used to compute SDO/AIA labeled data for an arbitrary frame of dataset E. Panel (a) displays the SST Hα blue wing and EBs highlighted by blue contours. Panel (b) shows the same data as the previous panel but downsampled and coaligned with SDO data of the same target region. Panel (c) shows the square root of the product of SDO/AIA 1600 Å and 1700 Å. Red contours indicate pixels above the threshold and blue contours represent the EBs from the SST. Panel (d) shows SDO/AIA 1700 Å passband for the target region with the resulting masks in yellow contours. These yellow contours are selected as the red contours in panel (c) which overlap with the blue contours. Panel (a) is displayed using its data coordinate system. The arrows at the top left of this panel point towards solar north (red), and west (blue) for this reference frame. Panels (b), (c), and (d) are displayed using heliocentric coordinates.
Current usage metrics show cumulative count of Article Views (full-text article views including HTML views, PDF and ePub downloads, according to the available data) and Abstracts Views on Vision4Press platform.
Data correspond to usage on the plateform after 2015. The current usage metrics is available 48-96 hours after online publication and is updated daily on week days.
Initial download of the metrics may take a while.