Fig. 12.
Download original image
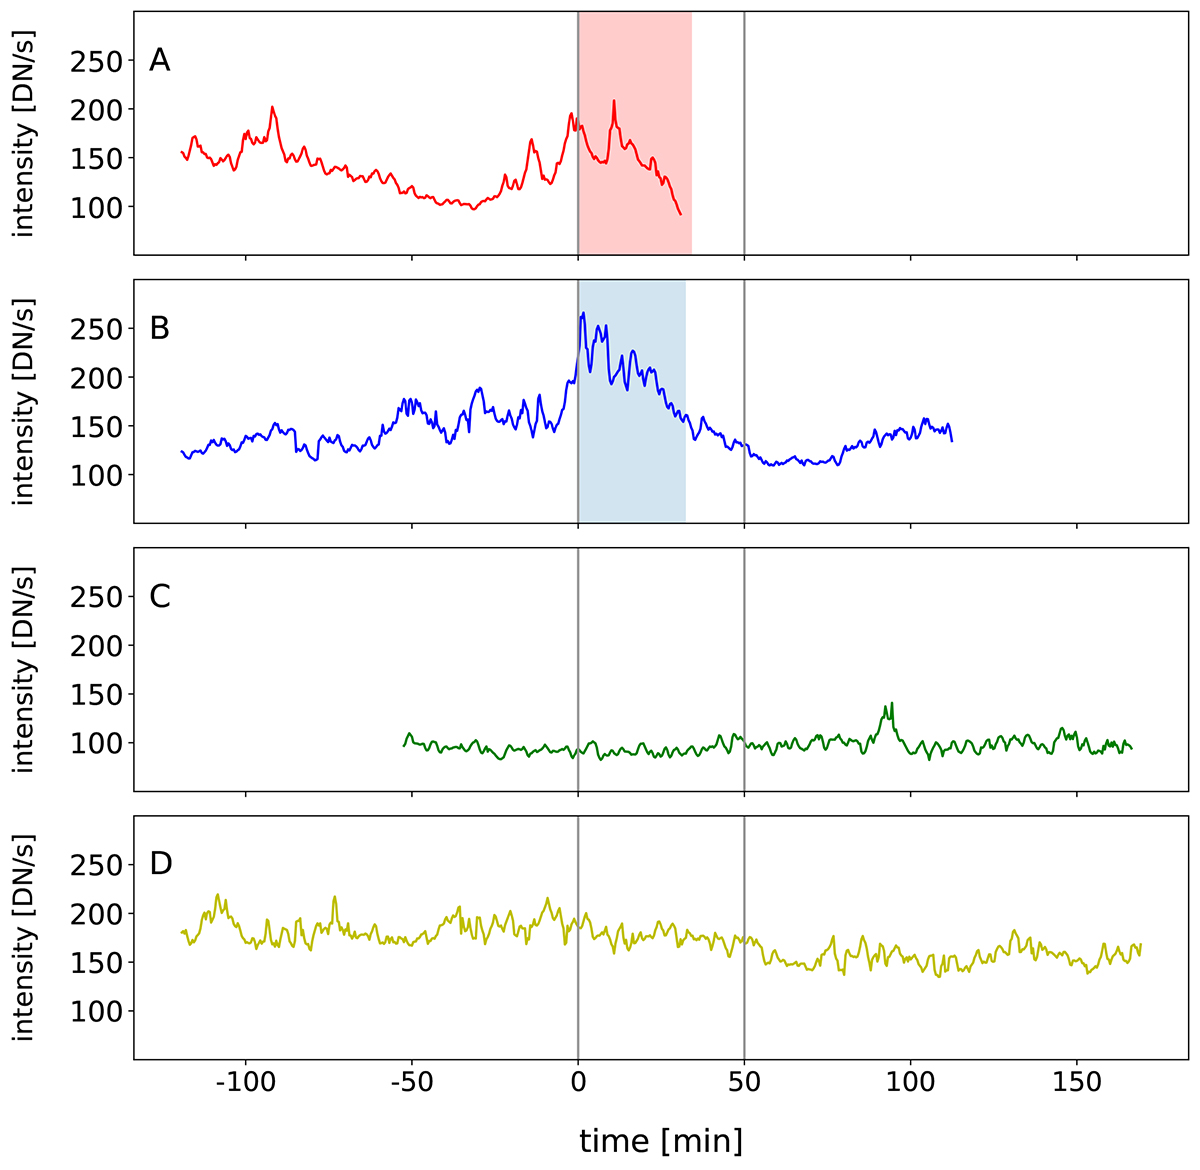
Temporal variation of the 1600 Å passband of SDO/AIA bright patches indicated in Fig. 9. Gray lines indicate the interval with SST co-temporal and co-spatial observations. Red and blue shaded areas in the two first panels indicate the EBs detected in Hα observations associated with bright patches A and B. An offset is applied to the x-axis to have 0 at the start of the SST observation.
Current usage metrics show cumulative count of Article Views (full-text article views including HTML views, PDF and ePub downloads, according to the available data) and Abstracts Views on Vision4Press platform.
Data correspond to usage on the plateform after 2015. The current usage metrics is available 48-96 hours after online publication and is updated daily on week days.
Initial download of the metrics may take a while.