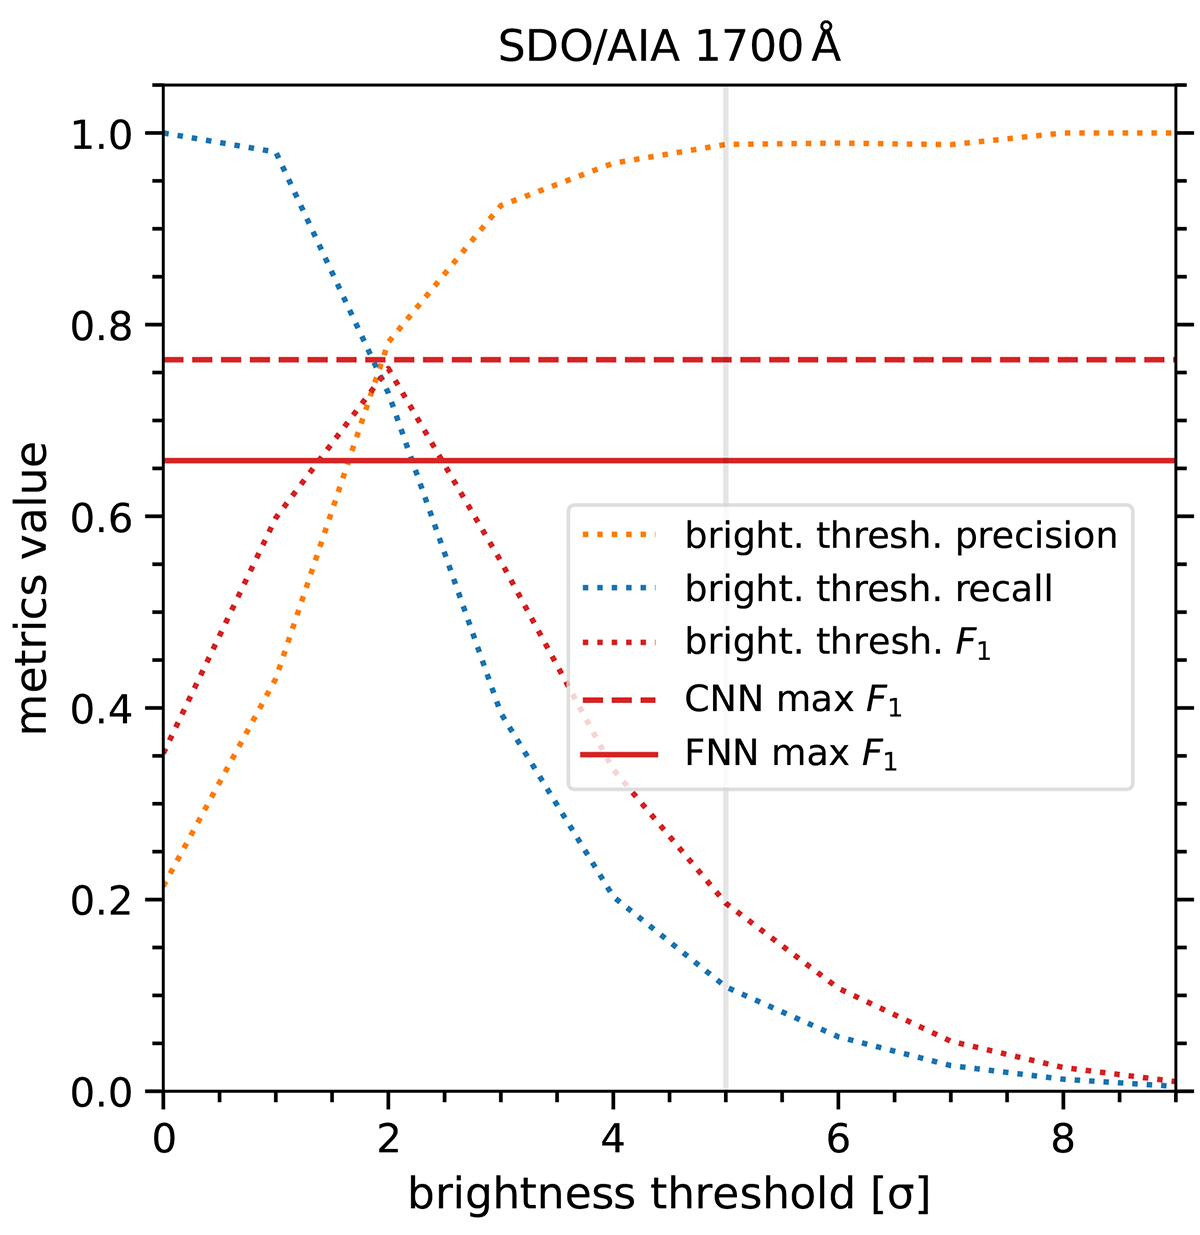
Fig. 11.
Download original image
Recall, precision, and F1 score for the brightness intensity threshold used to perform EB detection in SDO/AIA. The metric scores are shown as a function of the applied intensity threshold. The units of the thresholds is the number of standard deviation values (σ) above the local quiet-Sun average. For comparison, dashed and solid red lines indicate the maximum F1 score achieved by the FNN and CNN SDO models respectively. The gray vertical line indicates the threshold value suggested by Vissers et al. (2019b) at 5σ. These metrics have been computed using the test set.
Current usage metrics show cumulative count of Article Views (full-text article views including HTML views, PDF and ePub downloads, according to the available data) and Abstracts Views on Vision4Press platform.
Data correspond to usage on the plateform after 2015. The current usage metrics is available 48-96 hours after online publication and is updated daily on week days.
Initial download of the metrics may take a while.