Fig. 10.
Download original image
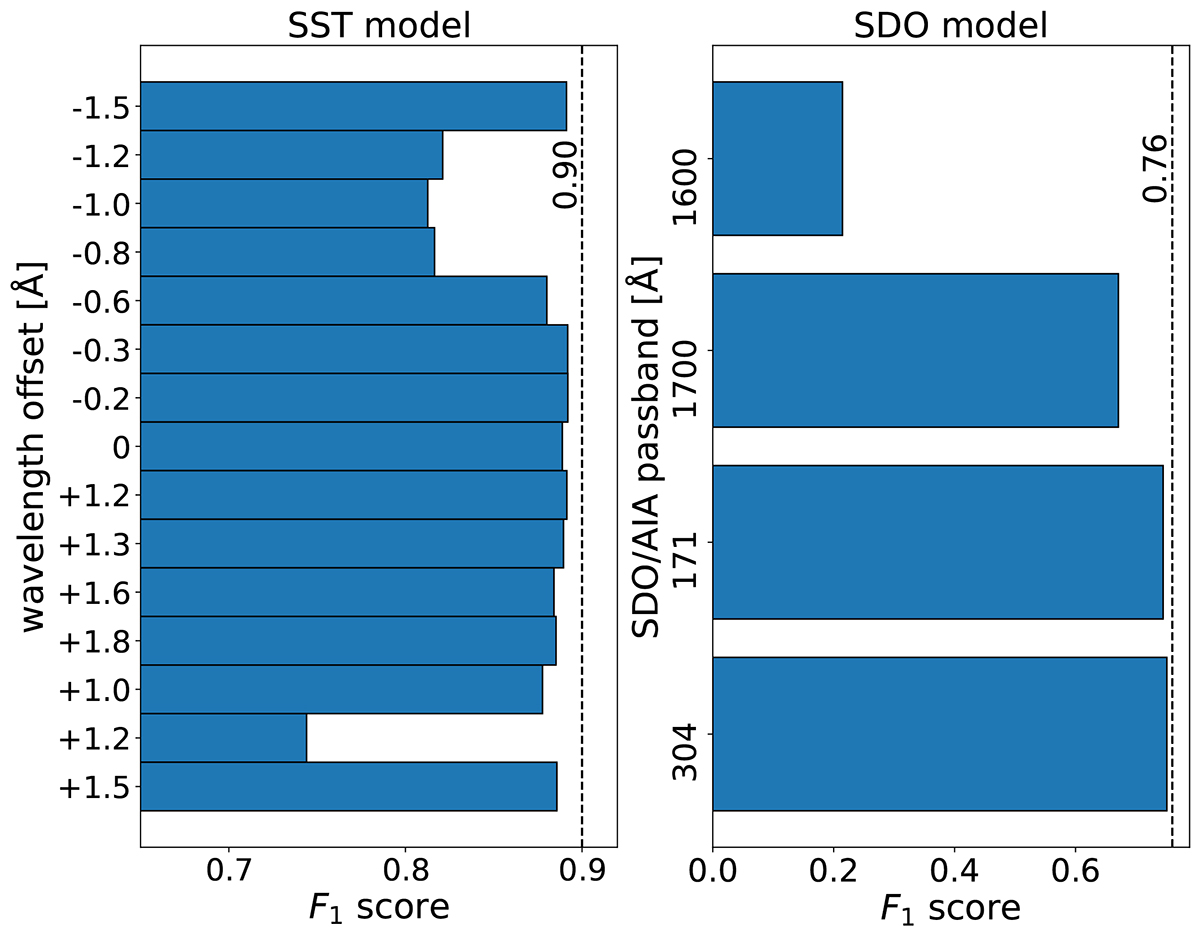
Computed F1 score for each input channel in the permutation feature importance assessment. The evaluated channel is shuffled to measure performance loss, where a lower score indicates higher importance. The left panel shows the results for the SST input features (wavelength offsets in Hα) and the right panel displays the results for the SDO/AIA passbands. Both panels show the results for the CNN architecture. A dashed vertical line indicates the score without shuffling the input features.
Current usage metrics show cumulative count of Article Views (full-text article views including HTML views, PDF and ePub downloads, according to the available data) and Abstracts Views on Vision4Press platform.
Data correspond to usage on the plateform after 2015. The current usage metrics is available 48-96 hours after online publication and is updated daily on week days.
Initial download of the metrics may take a while.