Fig. 2.
Download original image
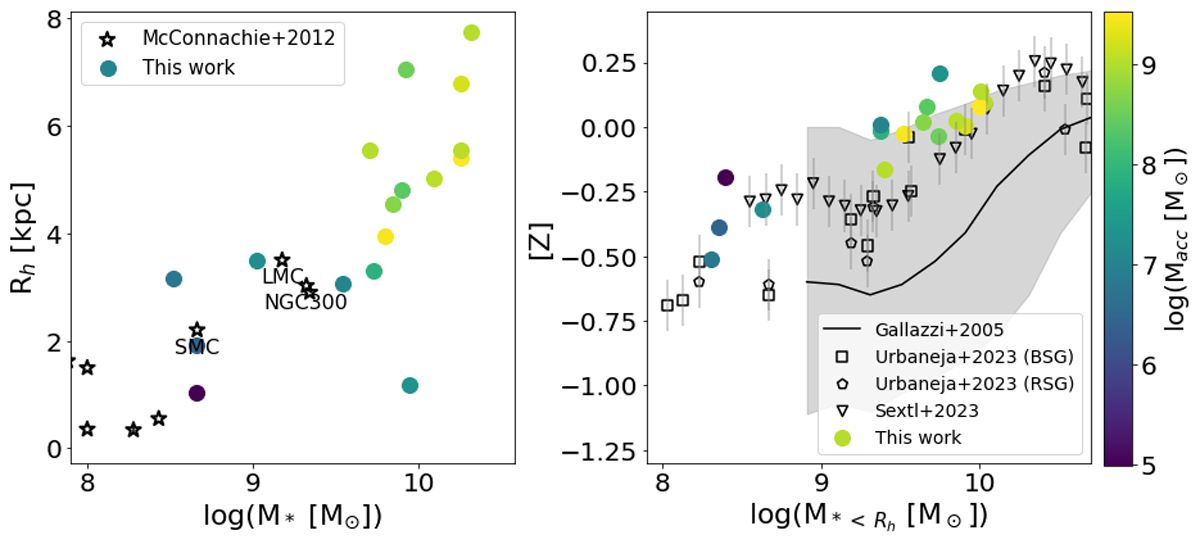
Left panel: Computed Rh for the galaxies of our sample as a function of their total stellar mass. The star symbols represent observational data of some relatively isolated dwarf galaxies taken from McConnachie (2012) that fit our mass range and the LMC and SMC. Right panel: Computed mean metallicities for each galaxy of our sample as a function of their stellar mass within Rh. Observational data of some galaxies taken from Urbaneja et al. (2023) and Sextl et al. (2023) are represented with pentagons (for red supergiants, RSG) and squares (for blue supergiants, BSG), and upside-down triangles, respectively. The solid line represents data taken from Gallazzi et al. (2005) for a sample of 44 254 galaxies taken from SDSS. In both panels, the simulated galaxies are colour-coded by their amount of total accreted stellar mass.
Current usage metrics show cumulative count of Article Views (full-text article views including HTML views, PDF and ePub downloads, according to the available data) and Abstracts Views on Vision4Press platform.
Data correspond to usage on the plateform after 2015. The current usage metrics is available 48-96 hours after online publication and is updated daily on week days.
Initial download of the metrics may take a while.