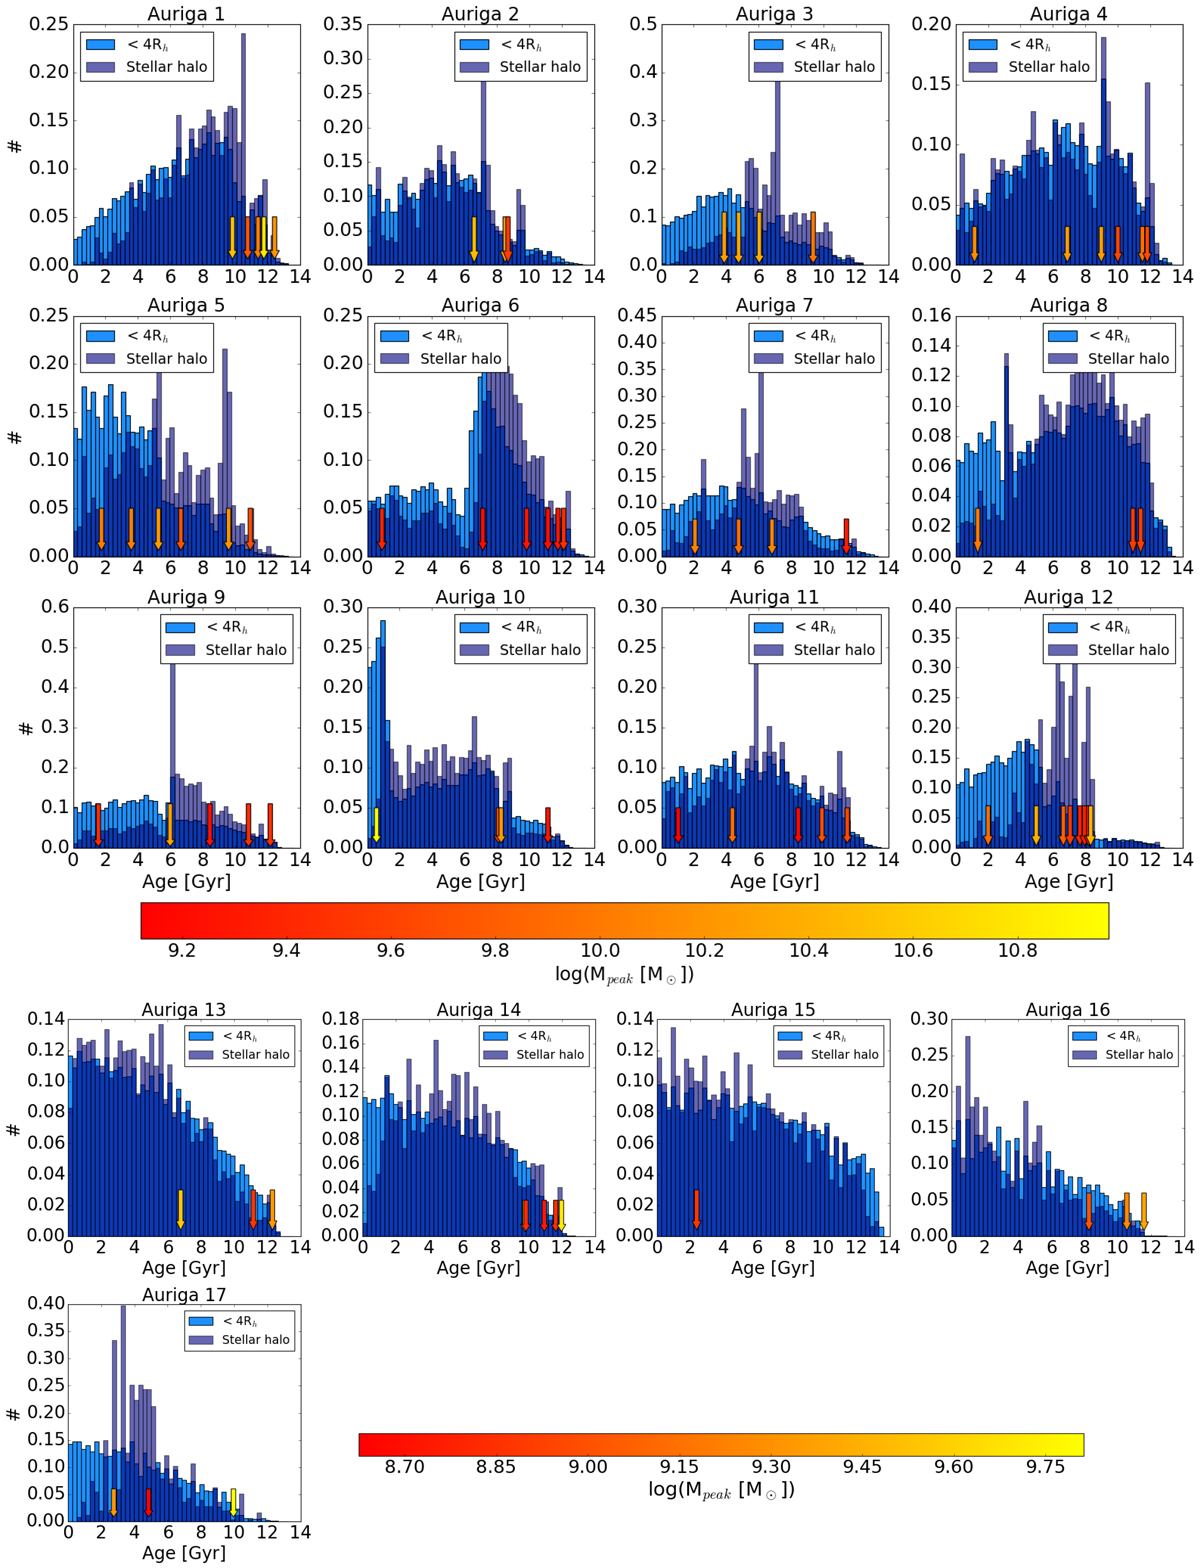
Fig. A.1.
Download original image
Star formation history of the in situ stellar populations of each galaxy in our sample. Light-blue histograms represent the star formation history of the in situ stellar particles located within 4 Rh, while violet histograms represent that of the in situ stellar halo. Arrows represent the time at which the galaxies underwent merger events, and only merger events that satisfy that the maximum total mass reached by the satellite was ![]() times the M200 of the main galaxy are being shown. The arrows are colour-coded according to the maximum total mass reached by the satellites. The galaxies are plotted in order of decreasing stellar mass.
times the M200 of the main galaxy are being shown. The arrows are colour-coded according to the maximum total mass reached by the satellites. The galaxies are plotted in order of decreasing stellar mass.
Current usage metrics show cumulative count of Article Views (full-text article views including HTML views, PDF and ePub downloads, according to the available data) and Abstracts Views on Vision4Press platform.
Data correspond to usage on the plateform after 2015. The current usage metrics is available 48-96 hours after online publication and is updated daily on week days.
Initial download of the metrics may take a while.