Fig. 11.
Download original image
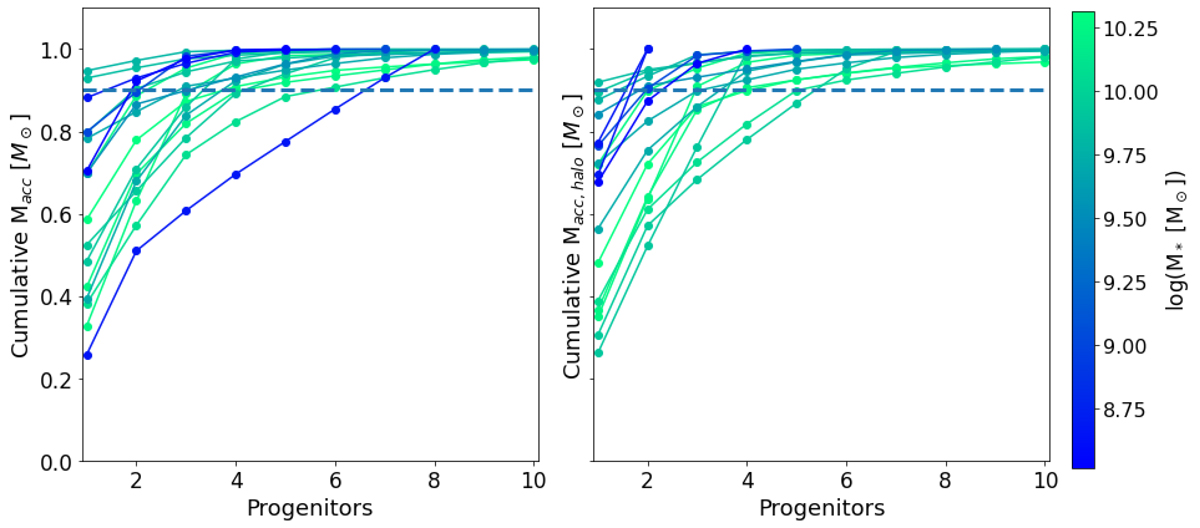
Left panel: Cumulative accreted stellar mass as a function of the progenitors of each galaxy. Right panel: Cumulative sum of the accreted stellar mass located in the stellar halo as a function of the progenitors. We only show up to ten progenitors for the most massive dwarf galaxies, but some of them have even more. The threshold that marks 90% of the accreted mass is represented with a horizontal dashed line. We do not find a correlation between the number of significant progenitors and the stellar mass of the galaxies.
Current usage metrics show cumulative count of Article Views (full-text article views including HTML views, PDF and ePub downloads, according to the available data) and Abstracts Views on Vision4Press platform.
Data correspond to usage on the plateform after 2015. The current usage metrics is available 48-96 hours after online publication and is updated daily on week days.
Initial download of the metrics may take a while.