Fig. 10.
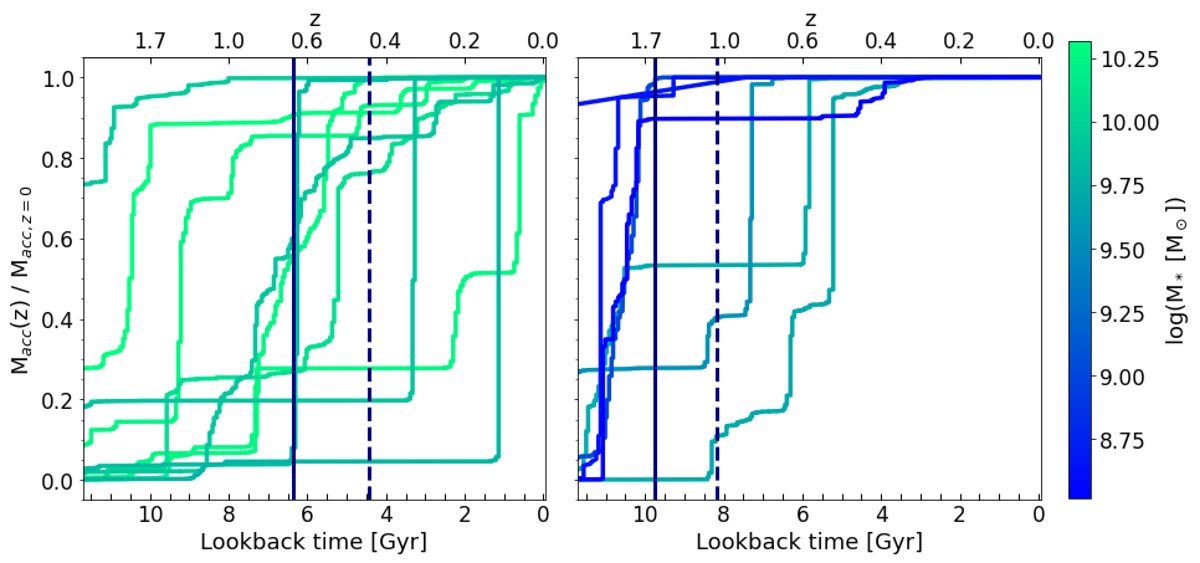
Download original image
Evolution through time of the ratio between the accreted mass at a given z and the total amount of accreted stellar mass at z = 0. Left panel: Galaxies with stellar mass ranging from 6.30 × 10⁹ M⊙ to 2.08 × 10¹⁰ M⊙. Right panel: Galaxies with stellar masses ranging from 3.28 × 10⁸ M⊙ to 5.34 × 10⁹ M⊙. The solid and dashed vertical lines represent the mean look-back time by which the galaxies in those panels had already accreted 50% and 90% of their accreted material, respectively.
Current usage metrics show cumulative count of Article Views (full-text article views including HTML views, PDF and ePub downloads, according to the available data) and Abstracts Views on Vision4Press platform.
Data correspond to usage on the plateform after 2015. The current usage metrics is available 48-96 hours after online publication and is updated daily on week days.
Initial download of the metrics may take a while.