Fig. 5.
Download original image
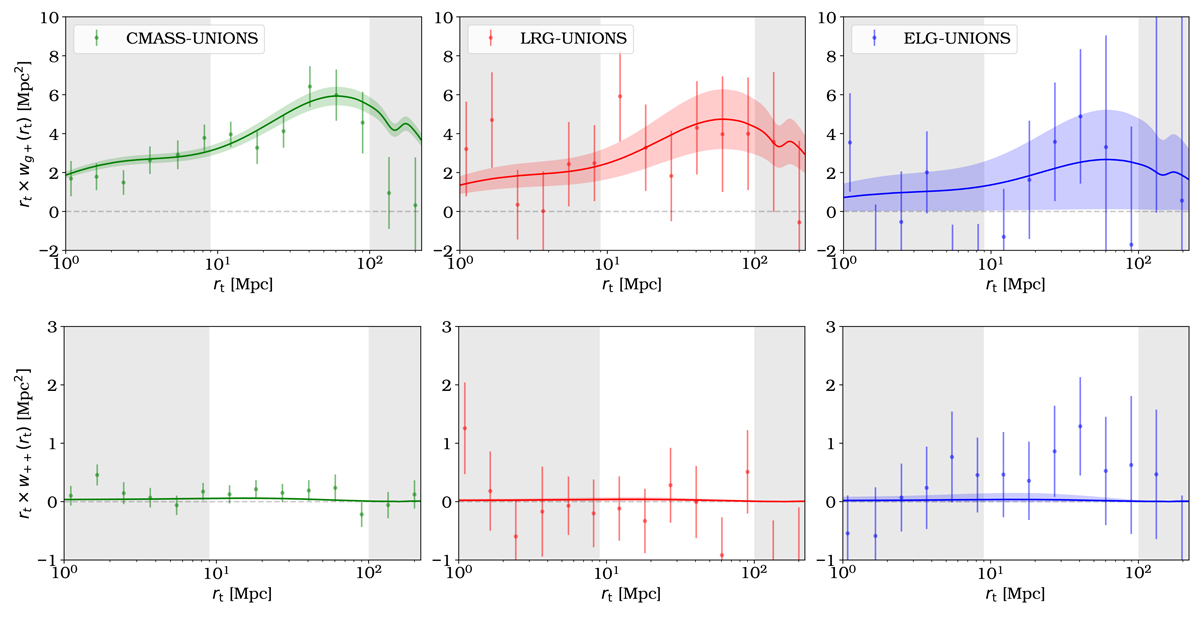
Measurements of wg+ (upper panels) and w++ (lower row) for the UNIONS-CMASS (left), UNIONS-LRG (middle), and UNIONS-ELG (right column) samples. The solid lines show the best-fit NLA model, where the shaded areas indicate the 1σ uncertainty associated with the fit. The grey areas are excluded from the fit as explained in Sect. 4.7.
Current usage metrics show cumulative count of Article Views (full-text article views including HTML views, PDF and ePub downloads, according to the available data) and Abstracts Views on Vision4Press platform.
Data correspond to usage on the plateform after 2015. The current usage metrics is available 48-96 hours after online publication and is updated daily on week days.
Initial download of the metrics may take a while.