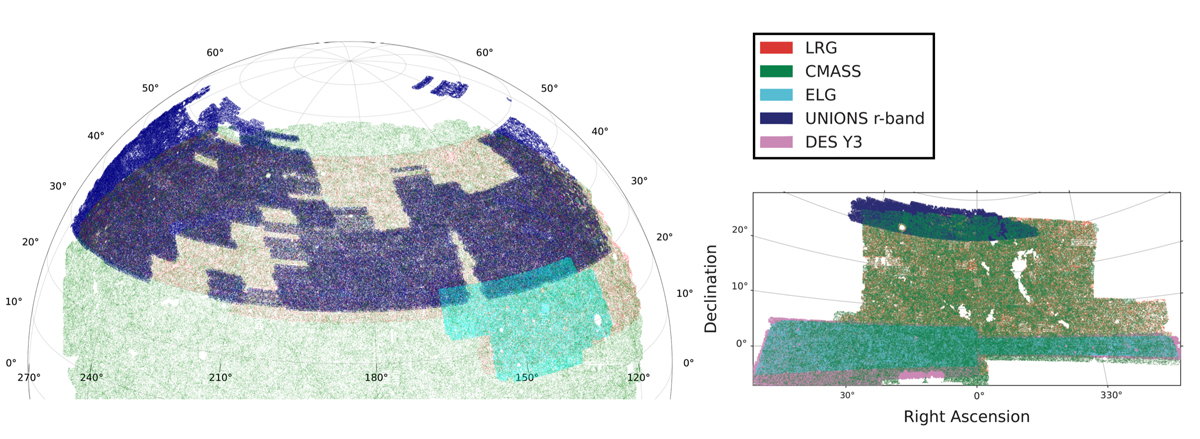
Fig. 1.
Download original image
Distribution of the different spectroscopic and lensing samples used in this work. The plot on the left shows the North Galactic Cap (NGC), where most UNIONS galaxies lie. On the right is a portion of the South Galactic Cap (SGC), with the DES Y3 observations in the most southern part. There is no overlap between the UNIONS and DES Y3 catalogues. The apparent variation in shades between the two panels is due to the two projections resulting in different point densities.
Current usage metrics show cumulative count of Article Views (full-text article views including HTML views, PDF and ePub downloads, according to the available data) and Abstracts Views on Vision4Press platform.
Data correspond to usage on the plateform after 2015. The current usage metrics is available 48-96 hours after online publication and is updated daily on week days.
Initial download of the metrics may take a while.