Fig. 9.
Download original image
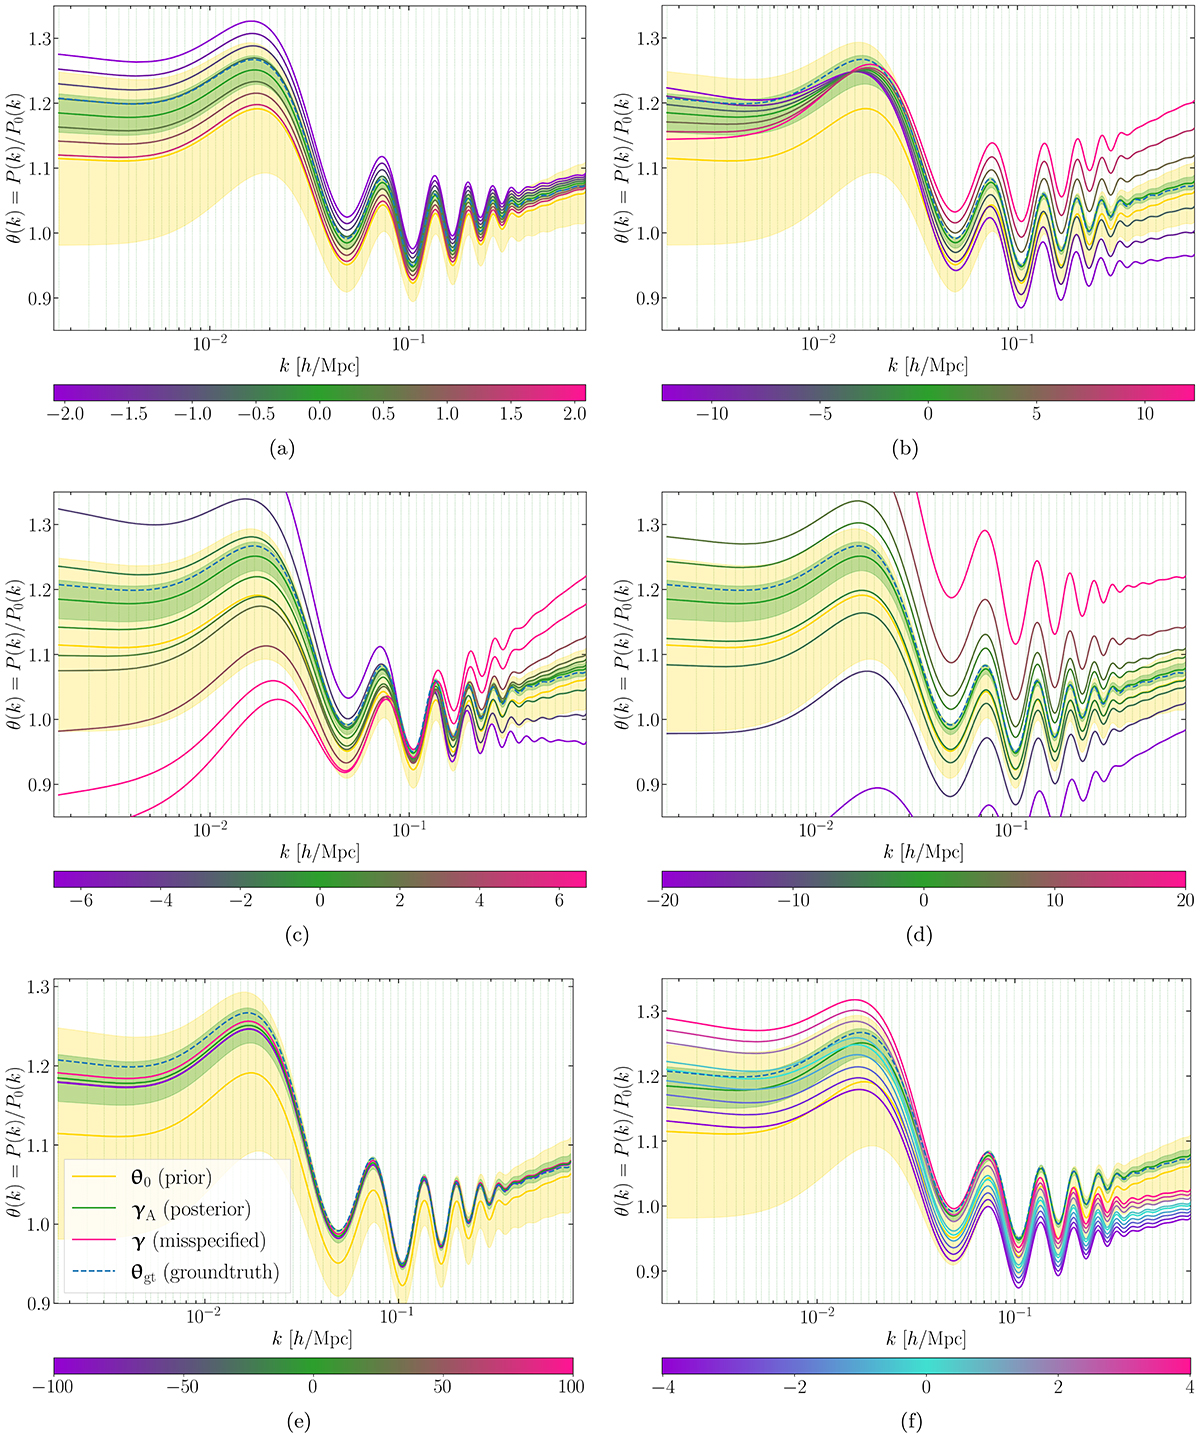
Ensemble of SELFI posteriors for the initial matter power spectrum θ conditional on the observed data ΦO for different observational models, used to diagnose systematic effects. All the posteriors are derived from a single, common set of N-body simulations. They make it possible to disentangle individual systematic contributions by comparing their differential impact across the range of wave numbers spanned by the power spectra. The colour scales indicate the relative error associated with the systematic effects considered in each sub-figure. The solid yellow line denotes the prior mean θ0 and the ground truth θgt is indicated by the dashed blue line. The vertical dashed lines indicate the support wave numbers for the initial matter power spectrum representation. The 2σ credible regions for the prior and the posterior with the well-specified Model A correspond to the shaded yellow and green areas, respectively. The posterior means γ are represented by the coloured continuous lines for varying degrees of misspecification. For clarity, their corresponding credible regions have been omitted. (a) Impact of misspecified linear galaxy biases. (b) Impact of misspecified linear extinction. (c) Impact of misspecified redshifts. (d) Impact of misspecified selection function variances. (e) Impact of misspecified number of holes. (f) Impact of misspecified selection function variances (varying) under misspecified linear extinction (fixed).
Current usage metrics show cumulative count of Article Views (full-text article views including HTML views, PDF and ePub downloads, according to the available data) and Abstracts Views on Vision4Press platform.
Data correspond to usage on the plateform after 2015. The current usage metrics is available 48-96 hours after online publication and is updated daily on week days.
Initial download of the metrics may take a while.