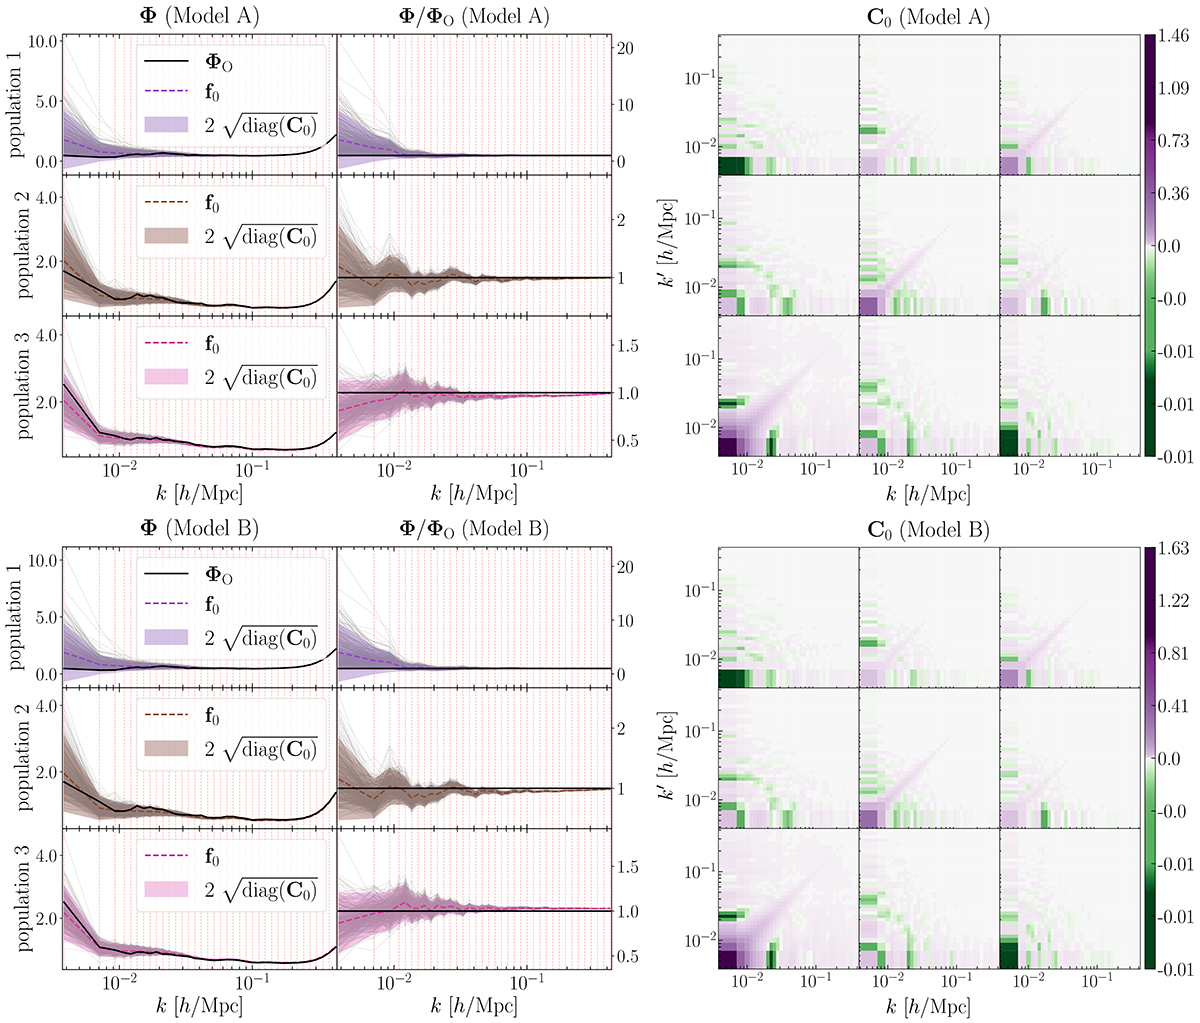
Fig. 6.
Download original image
Data intervening in the computation of the SELFI posterior. (Left panels) Observed and simulated summary statistics for Model A (well-specified; upper panel) and B (misspecified; lower panel). For each population, the simulated summaries are shown in grey and their means are represented as dotted coloured lines. The shaded areas correspond to ±2σ around their mean. The solid black line corresponds to the observations ΦO. The binning is indicated by the vertical dashed lines. Right panels: covariance matrices for Models A and B. For each (k, k′) entry, the colour scale represents the covariance between the k-th and k′-th modes. The diagonal blocs of the full covariance matrix correspond to the intra-population covariance; the extra-diagonal blocs correspond to the inter-populations covariances.
Current usage metrics show cumulative count of Article Views (full-text article views including HTML views, PDF and ePub downloads, according to the available data) and Abstracts Views on Vision4Press platform.
Data correspond to usage on the plateform after 2015. The current usage metrics is available 48-96 hours after online publication and is updated daily on week days.
Initial download of the metrics may take a while.