Fig. 4.
Download original image
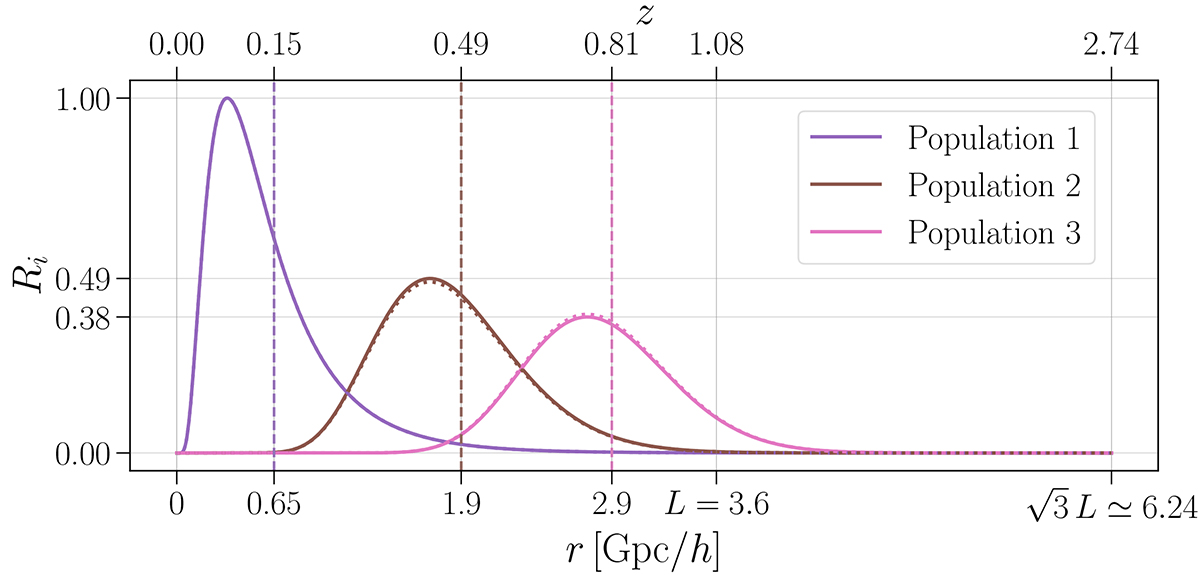
Radial selection functions modelled as log-normal distributions in redshift (upper x axis) for the three mock galaxy populations. In the figure, the distributions are represented with respect to comoving distances (lower x axis) using the redshift-distance relation. The continuous lines represent the selection functions for the well-specified Model A, while the dotted lines represent the misspecified Model B, both defined by the values provided in Table 4. The small, percent-order difference between Models A and B renders the dotted curves nearly indistinguishable from the solid ones. The vertical dashed lines indicate the means of the log-normal distributions.
Current usage metrics show cumulative count of Article Views (full-text article views including HTML views, PDF and ePub downloads, according to the available data) and Abstracts Views on Vision4Press platform.
Data correspond to usage on the plateform after 2015. The current usage metrics is available 48-96 hours after online publication and is updated daily on week days.
Initial download of the metrics may take a while.