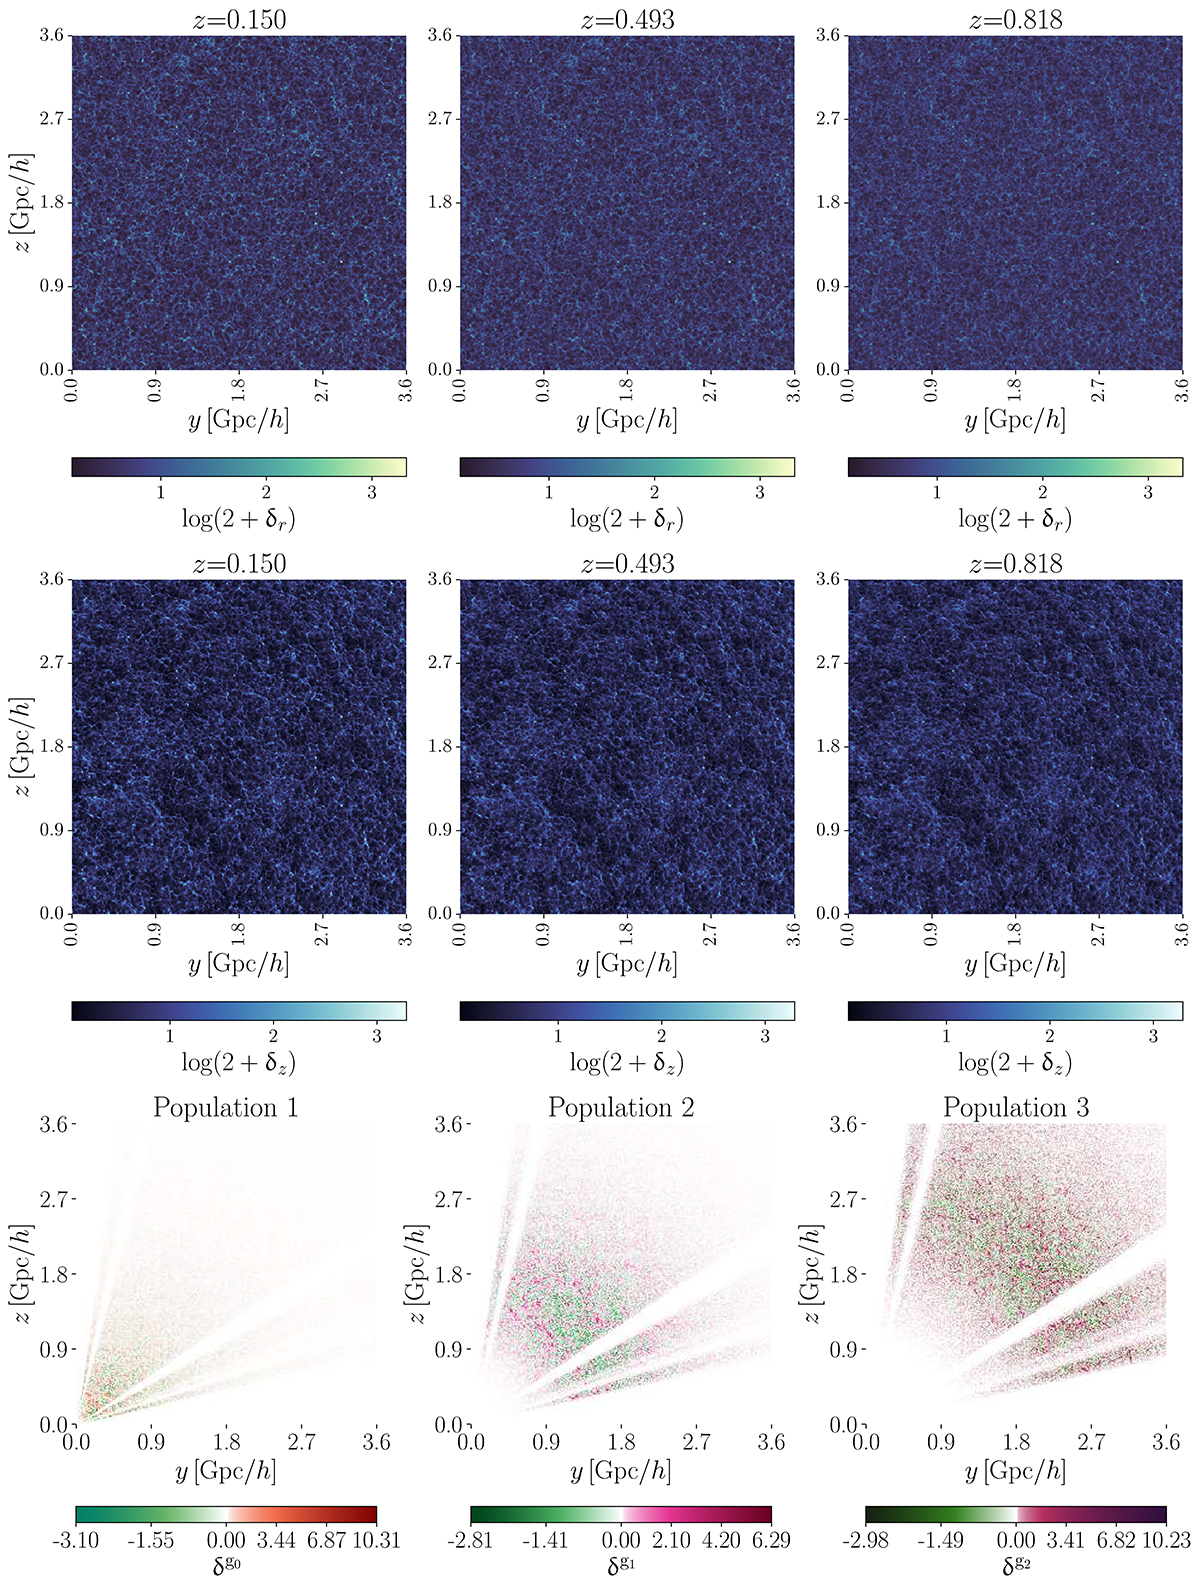
Fig. 3.
Download original image
Illustration of the galaxy survey data model used in this study. (Upper and middle rows) Slices through a realisation of the dark matter overdensity fields in real space (top) and redshift space (middle). The fields are evolved in time using N-body simulations, starting from a grid of Gaussian initial dark matter density fluctuations with power spectrum θgt, up to the redshift indicated above the corresponding panels. (Lower row) Observed galaxy number count fields for the three galaxy populations, each defined on a grid of 5123 cells. Light-cone effects are accounted for by using one effective redshift per galaxy population. Each slice passes through the observer located at the (0, 0, 0) corner of the box.
Current usage metrics show cumulative count of Article Views (full-text article views including HTML views, PDF and ePub downloads, according to the available data) and Abstracts Views on Vision4Press platform.
Data correspond to usage on the plateform after 2015. The current usage metrics is available 48-96 hours after online publication and is updated daily on week days.
Initial download of the metrics may take a while.