Fig. 12.
Download original image
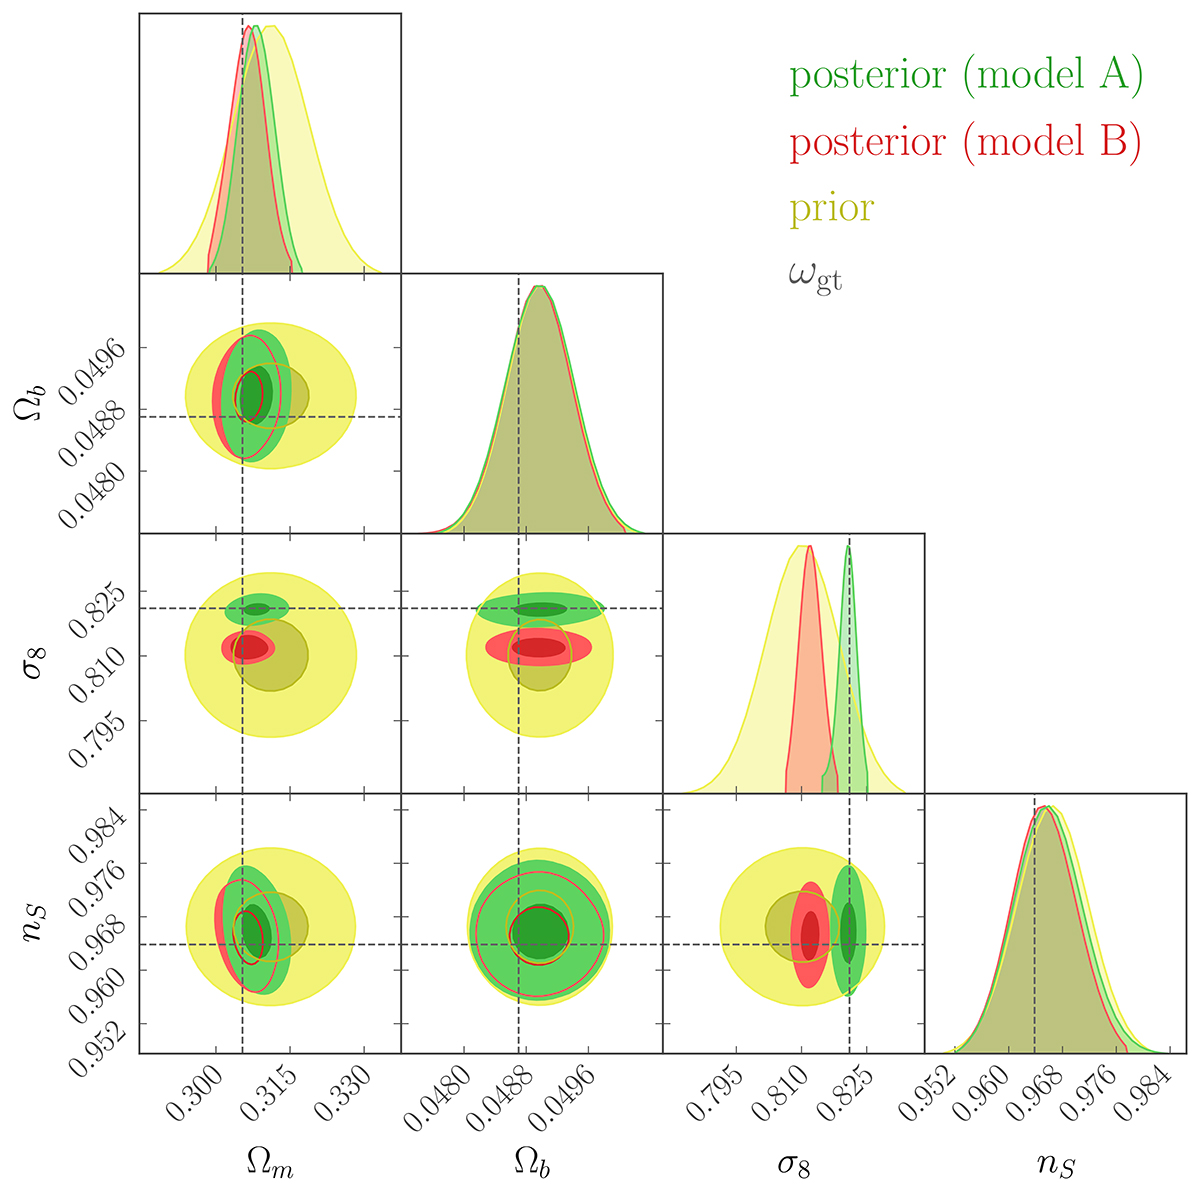
Prior 𝒫(ω) (yellow) and posterior ![]() distributions of (Ωm, Ωb, σ8, nS), estimated using Population Monte Carlo based on the Fisher-Rao distance
distributions of (Ωm, Ωb, σ8, nS), estimated using Population Monte Carlo based on the Fisher-Rao distance ![]() between simulated and observed summaries. The posterior with the well-specified Model A is represented by the green contours, whilst the red contours show the results with the misspecified Model B, both depicting the 1σ and 2σ credible regions. The percent-level misspecification in Model B introduces a bias exceeding 2σ in the (Ωm, σ8) plane. The one-dimensional marginal posterior distributions of the parameters are displayed on the diagonal, following the same colour scheme. The dashed line indicates the ground truth parameters ωgt.
between simulated and observed summaries. The posterior with the well-specified Model A is represented by the green contours, whilst the red contours show the results with the misspecified Model B, both depicting the 1σ and 2σ credible regions. The percent-level misspecification in Model B introduces a bias exceeding 2σ in the (Ωm, σ8) plane. The one-dimensional marginal posterior distributions of the parameters are displayed on the diagonal, following the same colour scheme. The dashed line indicates the ground truth parameters ωgt.
Current usage metrics show cumulative count of Article Views (full-text article views including HTML views, PDF and ePub downloads, according to the available data) and Abstracts Views on Vision4Press platform.
Data correspond to usage on the plateform after 2015. The current usage metrics is available 48-96 hours after online publication and is updated daily on week days.
Initial download of the metrics may take a while.