Open Access
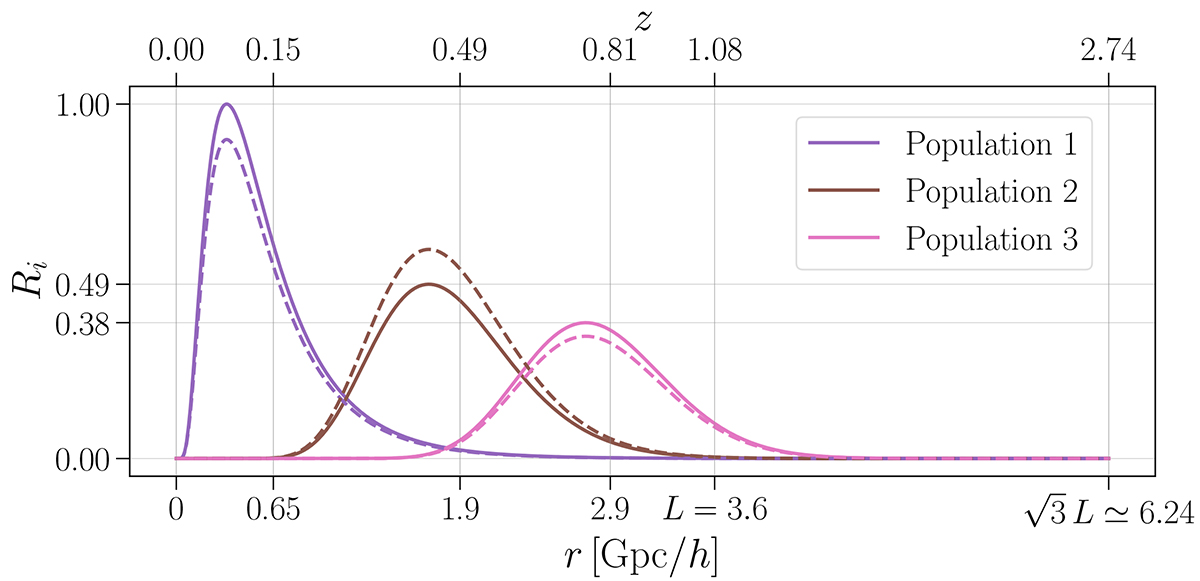
Fig. 10.
Download original image
Profiles of the well- and misspecified selection functions Ri for the three mock galaxy populations. The continuous lines represent the selection functions used in Model A. The dashed lines are derived by underestimating n1, 2(z) by 10% whilst maintaining ntot(z) constant.
Current usage metrics show cumulative count of Article Views (full-text article views including HTML views, PDF and ePub downloads, according to the available data) and Abstracts Views on Vision4Press platform.
Data correspond to usage on the plateform after 2015. The current usage metrics is available 48-96 hours after online publication and is updated daily on week days.
Initial download of the metrics may take a while.