Fig. B.1
Download original image
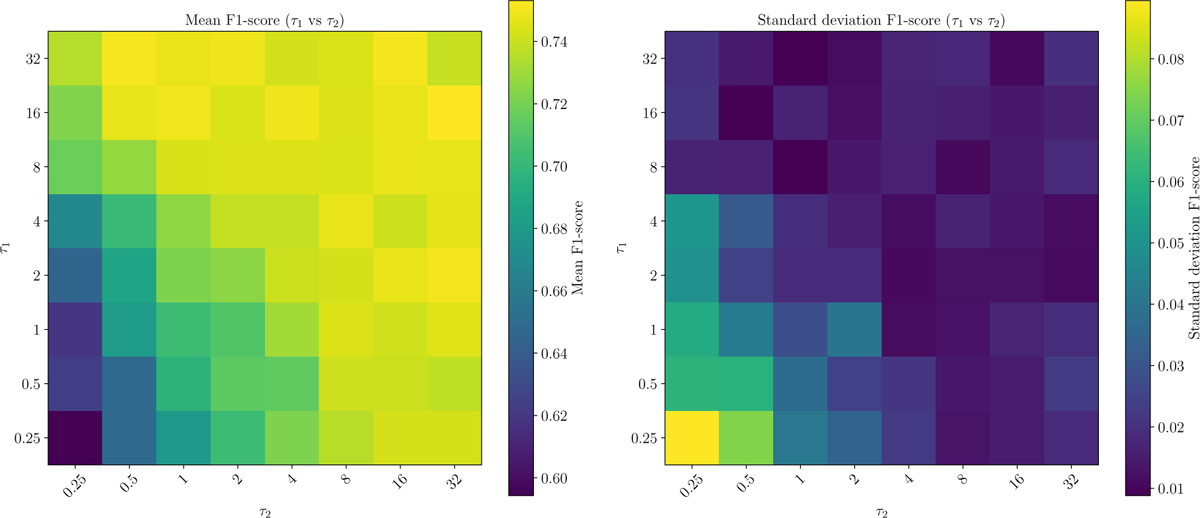
Effect of Gumbel-softmax temperatures on HSA performance. We show heatmaps of the mean F1-score (left) and standard deviation (right) over multiple runs on the MACHO test set for different combinations of the Gumbel-softmax temperature parameters, τ1 and τ2. Warmer colors in the left panel indicate higher mean F1-scores, while cooler colors in the right panel reflect a lower variance.
Current usage metrics show cumulative count of Article Views (full-text article views including HTML views, PDF and ePub downloads, according to the available data) and Abstracts Views on Vision4Press platform.
Data correspond to usage on the plateform after 2015. The current usage metrics is available 48-96 hours after online publication and is updated daily on week days.
Initial download of the metrics may take a while.