Fig. 4
Download original image
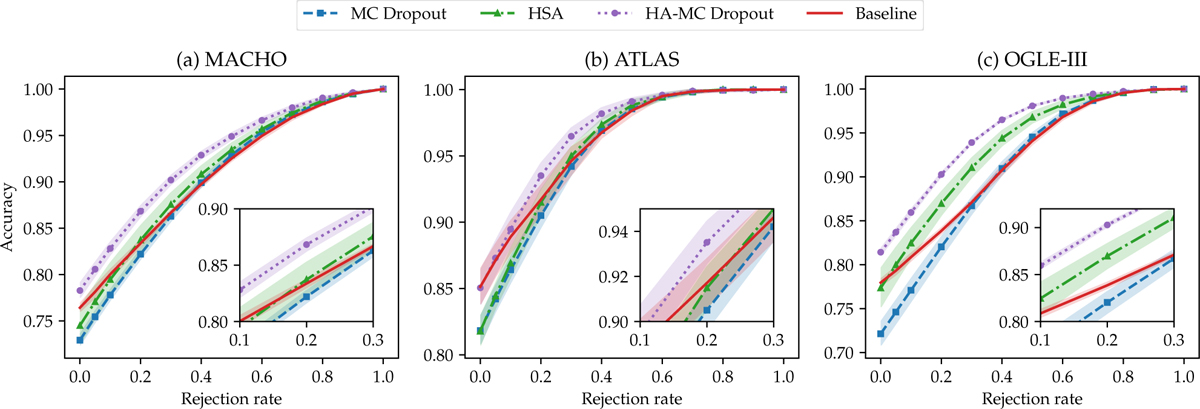
Accuracy-rejection curves for the MACHO (a), ATLAS (b), and OGLE-III (c) datasets. The techniques compared are MC Dropout (dash-squared line), HSA (dash-triangular line), HA-MC Dropout (dash-dotted line), and the baseline model (solid line). Insets zoom into the lower rejection rate region (0–0.3) to emphasize differences at low rejection levels.
Current usage metrics show cumulative count of Article Views (full-text article views including HTML views, PDF and ePub downloads, according to the available data) and Abstracts Views on Vision4Press platform.
Data correspond to usage on the plateform after 2015. The current usage metrics is available 48-96 hours after online publication and is updated daily on week days.
Initial download of the metrics may take a while.