Fig. 9.
Download original image
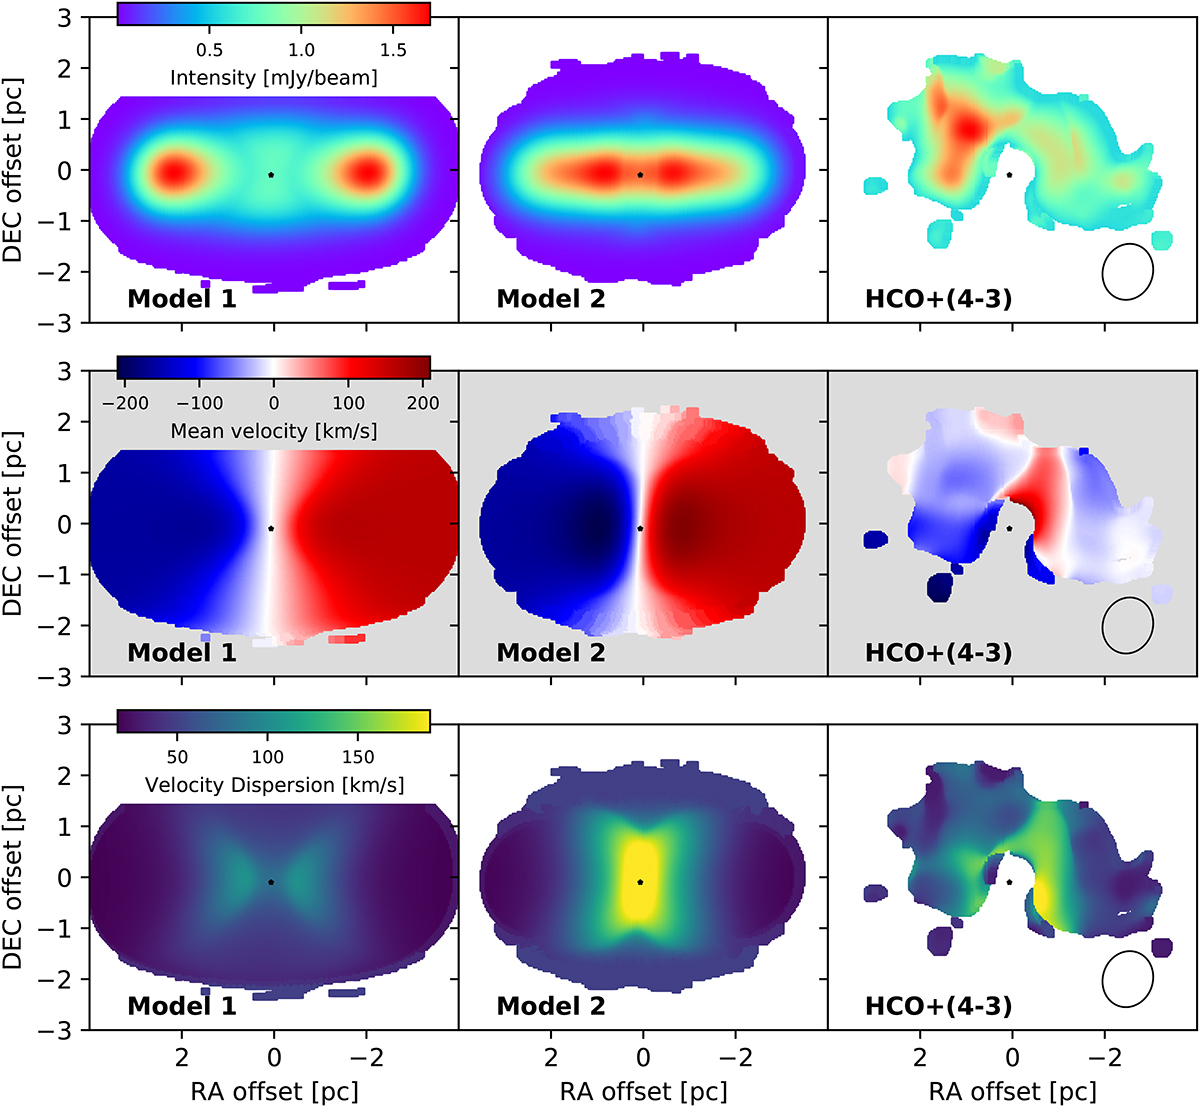
Intensities at the mean velocities (top row), mean velocities (middle row), and linewidths (bottom row) obtained from the Gaussian fit for Model 1 (left column), Model 2 (middle column), and the HCO+ (J = 4→3) (right column). For all figures: The ellipse in the right panel represents the size of the beam for the observations, which we used to convolve the images of the models. The colour bar on top of the left panel applies to the three sub-images. The coordinate system is rotated by 24° (see details in text).
Current usage metrics show cumulative count of Article Views (full-text article views including HTML views, PDF and ePub downloads, according to the available data) and Abstracts Views on Vision4Press platform.
Data correspond to usage on the plateform after 2015. The current usage metrics is available 48-96 hours after online publication and is updated daily on week days.
Initial download of the metrics may take a while.