Fig. 4.
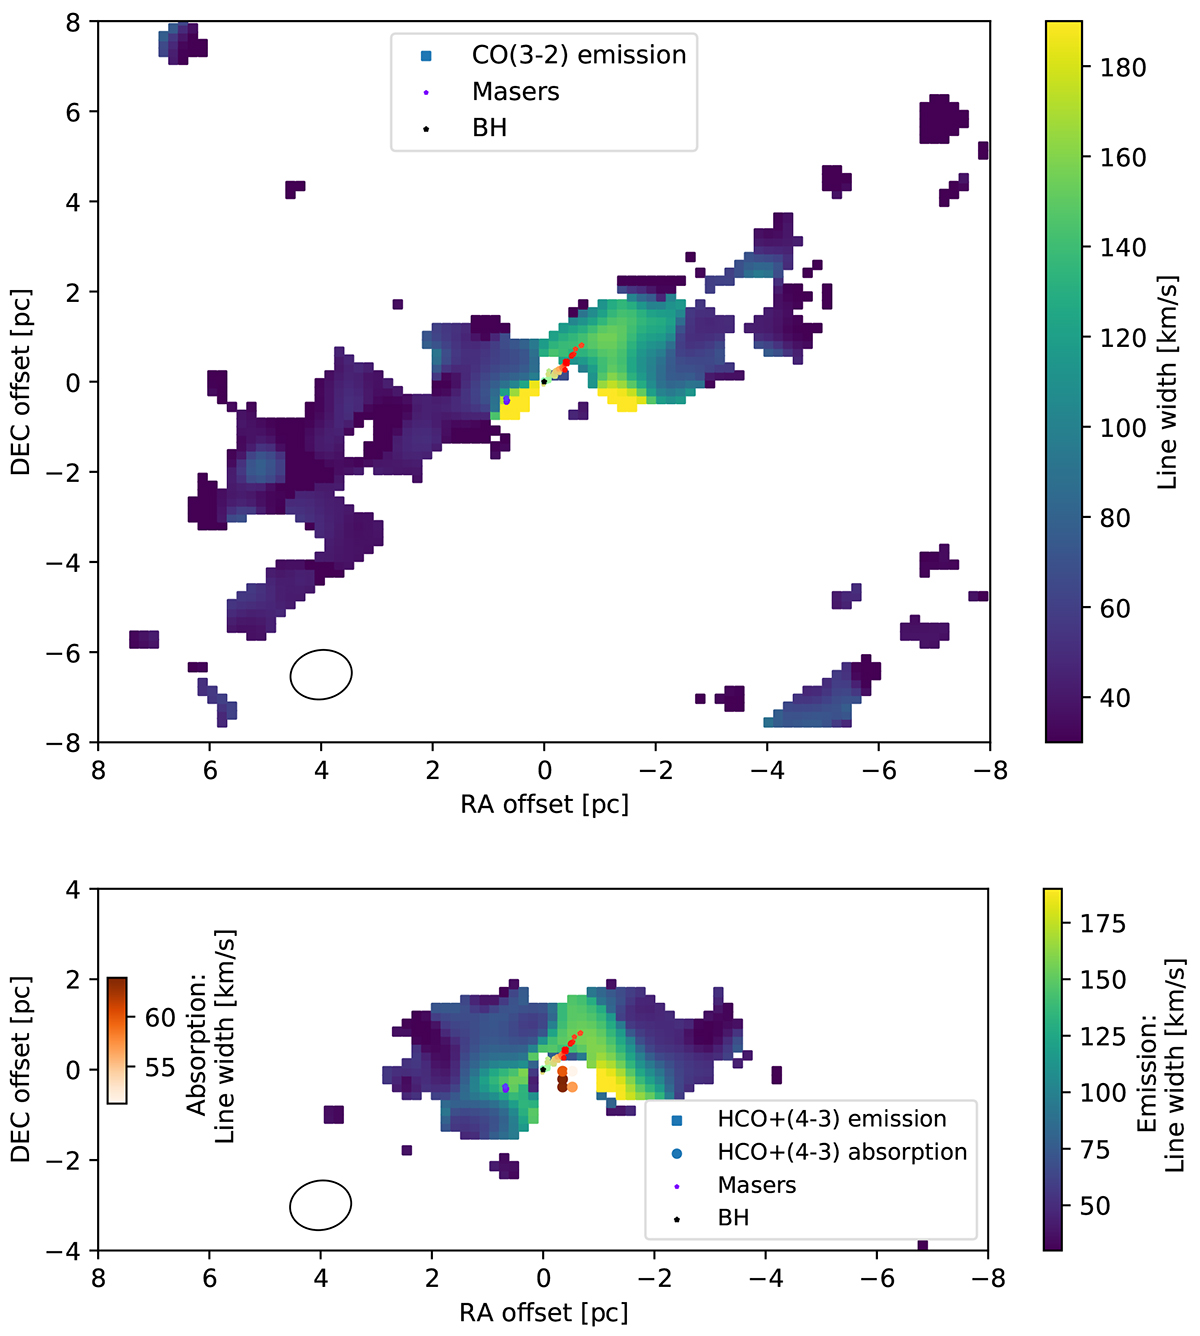
Download original image
Maps of CO and HCO+ linewidths s (Eq. (1)) in the nuclear region of NGC 1068. Emission linewidths are shown in blue-yellow pseudocolour according to the colour bar at right. Top: CO (J = 3→2) emission linewidths. Bottom: HCO+ (J = 4→3) emission and absorption linewidths (white-brown colour bar shown in the inset). In each plot, the ellipse in the lower left corner represents the beam size. North is up, and east is left. The black star marks the position of the supermassive black hole, and the small colourful dots represent the H2O megamaser disc (Gallimore et al. 2004).
Current usage metrics show cumulative count of Article Views (full-text article views including HTML views, PDF and ePub downloads, according to the available data) and Abstracts Views on Vision4Press platform.
Data correspond to usage on the plateform after 2015. The current usage metrics is available 48-96 hours after online publication and is updated daily on week days.
Initial download of the metrics may take a while.