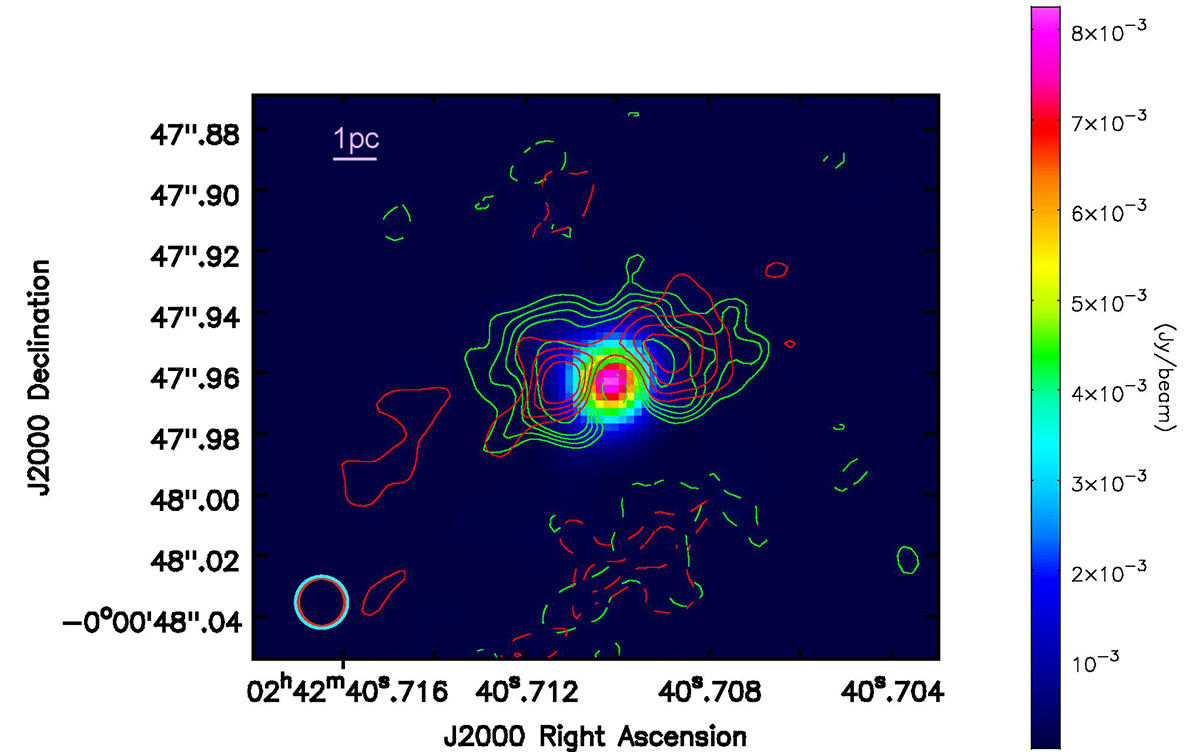
Fig. 1.
Download original image
Contours of the integrated CO (J = 3→2) (red contours) and HCO+ (J = 4→3) (green contours) emission over-plotted on the 350 GHz continuum image (pseudocolour). The levels for the contours are –4, –3, 3, 4, 5, and 6 times the rms of the CO (J = 3→2) moment 0 map (0.024 Jy/beam km/s) and –3, 3, 4, 5, 6, and 9 times the rms of the HCO+ (J = 4→3) moment 0 map (0.021 Jy/beam km/s). Dashed lines indicate negative contours. The negative features north and south of the AGN are caused by the short baselines missing in the imaging process. The beam size and shape (∼15.5×∼16.5 mas with a PA of –43°) for the two lines and the continuum are very similar, as marked by the ovals in red and cyan, respectively, in the lower left corner of the figure.
Current usage metrics show cumulative count of Article Views (full-text article views including HTML views, PDF and ePub downloads, according to the available data) and Abstracts Views on Vision4Press platform.
Data correspond to usage on the plateform after 2015. The current usage metrics is available 48-96 hours after online publication and is updated daily on week days.
Initial download of the metrics may take a while.