Open Access
Fig. C.1.
Download original image
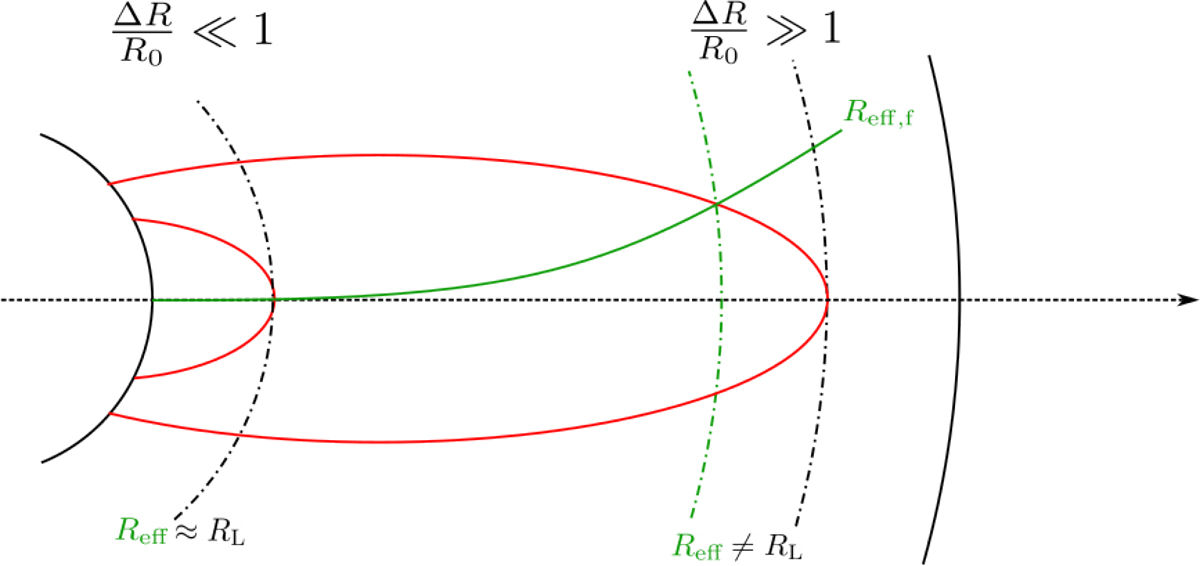
Schematic representation of the effective radius approximation used to derive peak frequency and flux from the hydrodynamical data depending on the asymptotical regime. The EATS is shown in red.
Current usage metrics show cumulative count of Article Views (full-text article views including HTML views, PDF and ePub downloads, according to the available data) and Abstracts Views on Vision4Press platform.
Data correspond to usage on the plateform after 2015. The current usage metrics is available 48-96 hours after online publication and is updated daily on week days.
Initial download of the metrics may take a while.