Fig. B.1.
Download original image
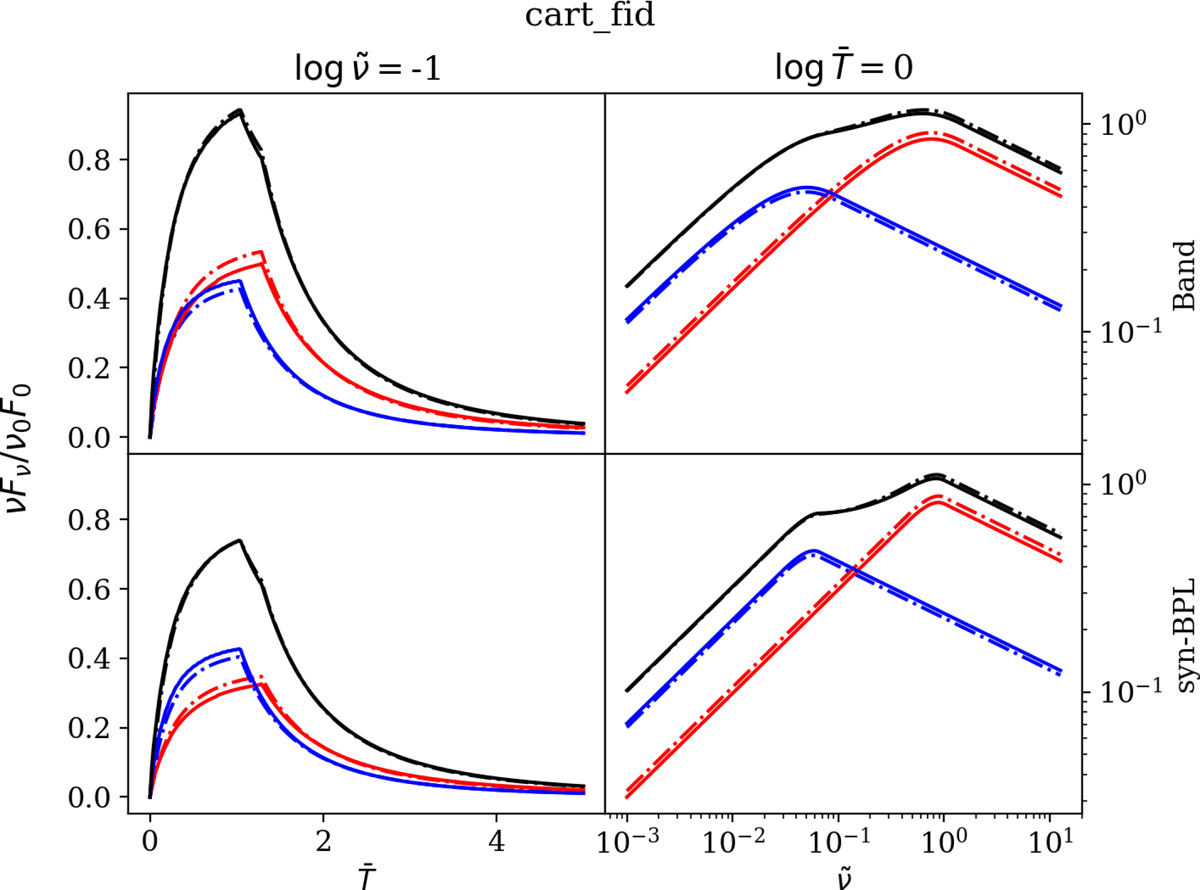
Light curves (left column) and instantaneous spectra (right column) obtained from the fiducial run in planar geometry (full lines) compared to the analytical expectations (dash-dotted lines). Normalizations of ![]() and
and ![]() are defined at the RS. The top row display the result for a Band spectral shape, and in the bottom the synchrotron broken power-law. The respective contributions of each shock to the total observed flux (in black) are given in red for the RS and blue for the FS.
are defined at the RS. The top row display the result for a Band spectral shape, and in the bottom the synchrotron broken power-law. The respective contributions of each shock to the total observed flux (in black) are given in red for the RS and blue for the FS.
Current usage metrics show cumulative count of Article Views (full-text article views including HTML views, PDF and ePub downloads, according to the available data) and Abstracts Views on Vision4Press platform.
Data correspond to usage on the plateform after 2015. The current usage metrics is available 48-96 hours after online publication and is updated daily on week days.
Initial download of the metrics may take a while.