Open Access
Fig. 1.
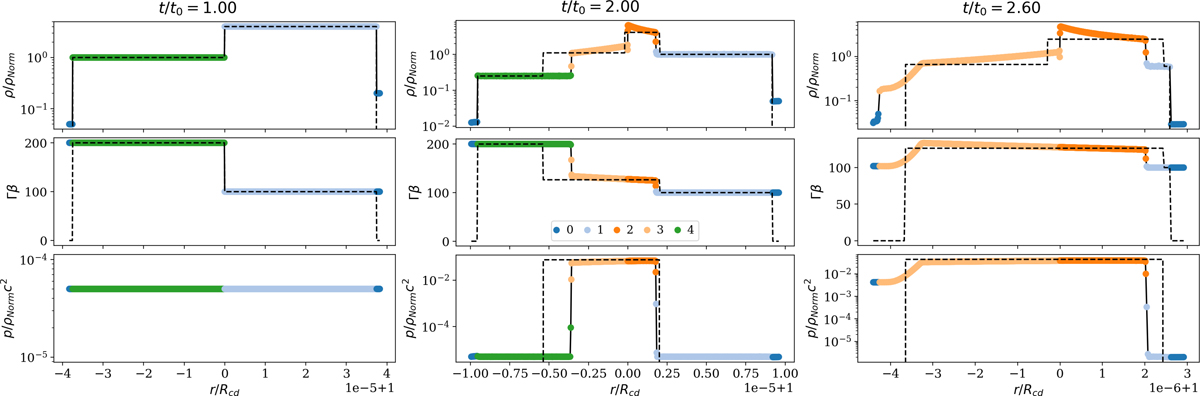
Download original image
Snapshots of the run in spherical geometry, with all parameters similar to the fiducial run, at t=t0 (left), before first (reverse) shock crossing (center), and after shock crossing (right). Dashed black lines show the analytical expectations from the results in planar geometry. The legend is the same for all panels.
Current usage metrics show cumulative count of Article Views (full-text article views including HTML views, PDF and ePub downloads, according to the available data) and Abstracts Views on Vision4Press platform.
Data correspond to usage on the plateform after 2015. The current usage metrics is available 48-96 hours after online publication and is updated daily on week days.
Initial download of the metrics may take a while.