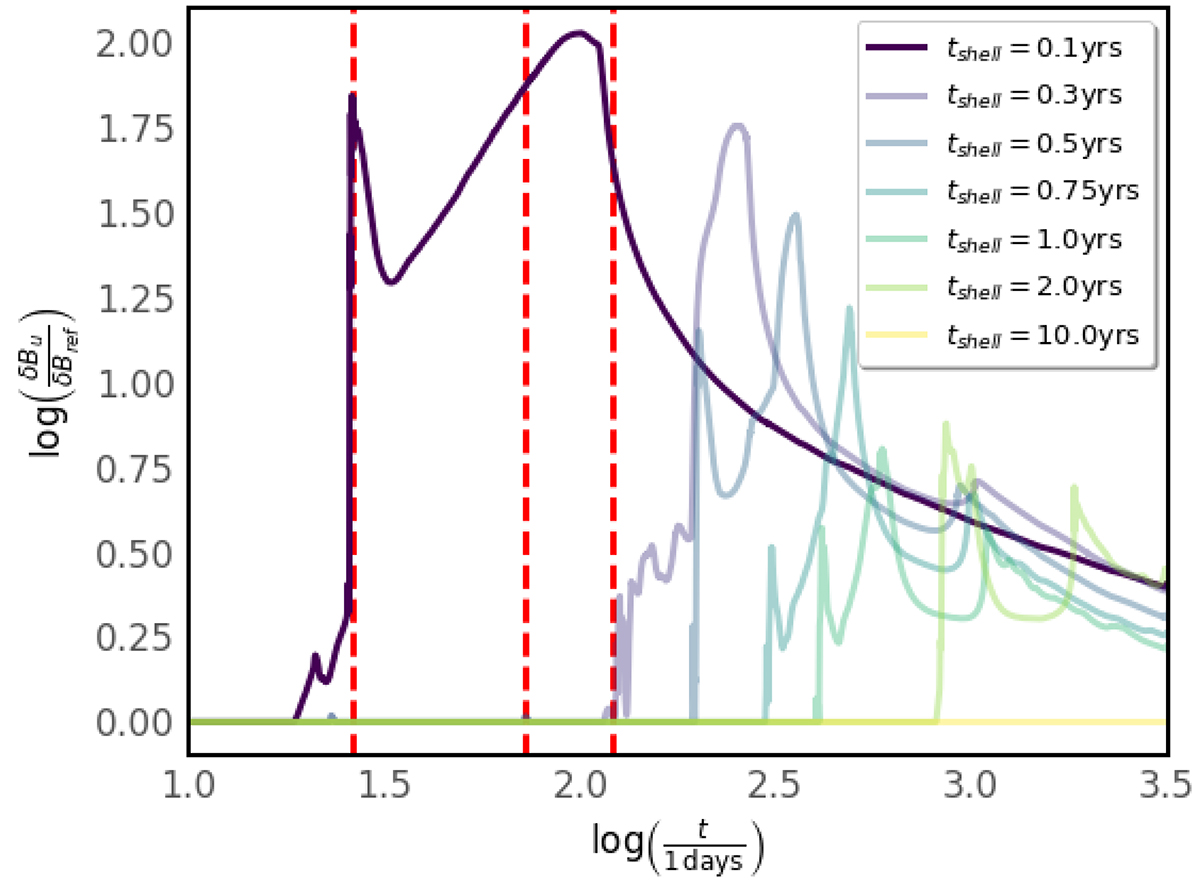
Fig. 4.
Download original image
Log ratio of the amplified magnetic field in the immediate upstream relative to the field of a simulation without any shell interactions, shown as the solid lines show. The vertical dashed red lines mark from left to right the times of the first shock-shell interaction, the time of when the shock reached the peak density of the shell, and the time when the shock is propagating in the free wind again for the simulation with the earliest shell interaction (strong line). The pale lines show the behavior for later shell interactins.
Current usage metrics show cumulative count of Article Views (full-text article views including HTML views, PDF and ePub downloads, according to the available data) and Abstracts Views on Vision4Press platform.
Data correspond to usage on the plateform after 2015. The current usage metrics is available 48-96 hours after online publication and is updated daily on week days.
Initial download of the metrics may take a while.