Open Access
Fig. 9
Download original image
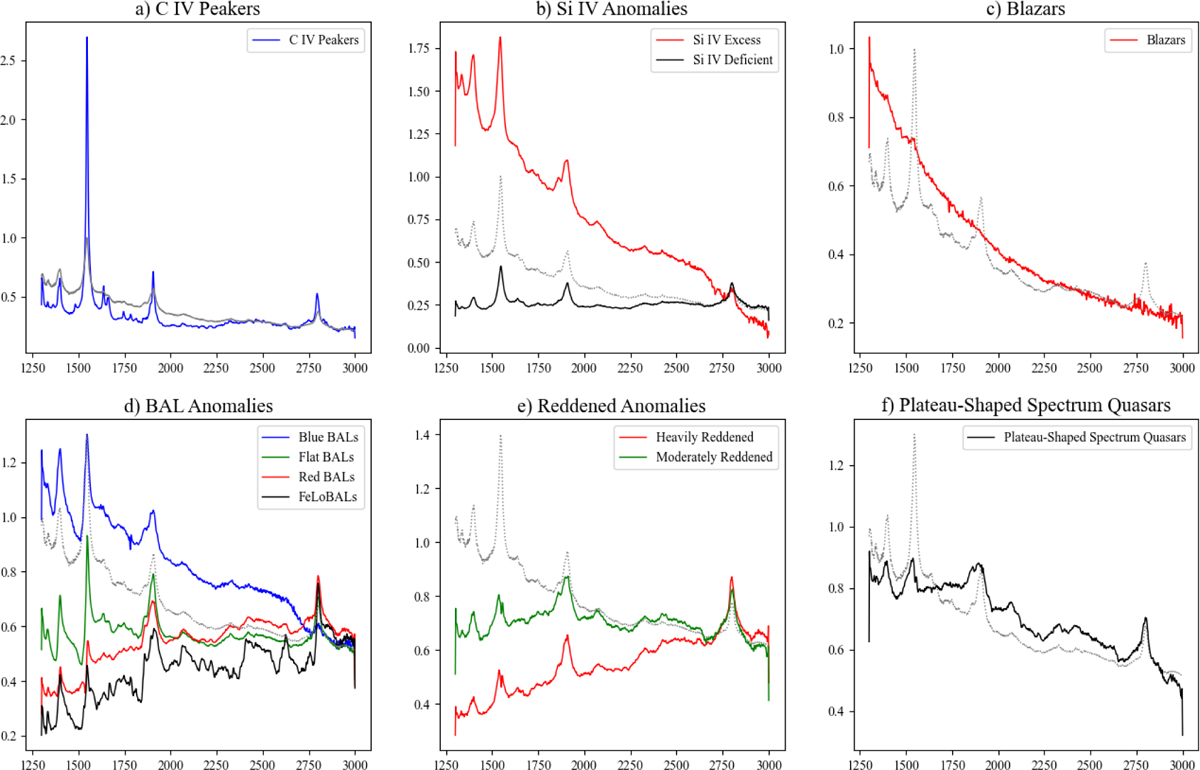
Composite spectra for all anomaly categories identified in this project. In each plot, the gray dotted spectrum represents the Vanden Berk et al. (2001) composite. All mean spectra are aligned at the Mg II emission peak to ensure consistent comparison across categories.
Current usage metrics show cumulative count of Article Views (full-text article views including HTML views, PDF and ePub downloads, according to the available data) and Abstracts Views on Vision4Press platform.
Data correspond to usage on the plateform after 2015. The current usage metrics is available 48-96 hours after online publication and is updated daily on week days.
Initial download of the metrics may take a while.