Fig. 8
Download original image
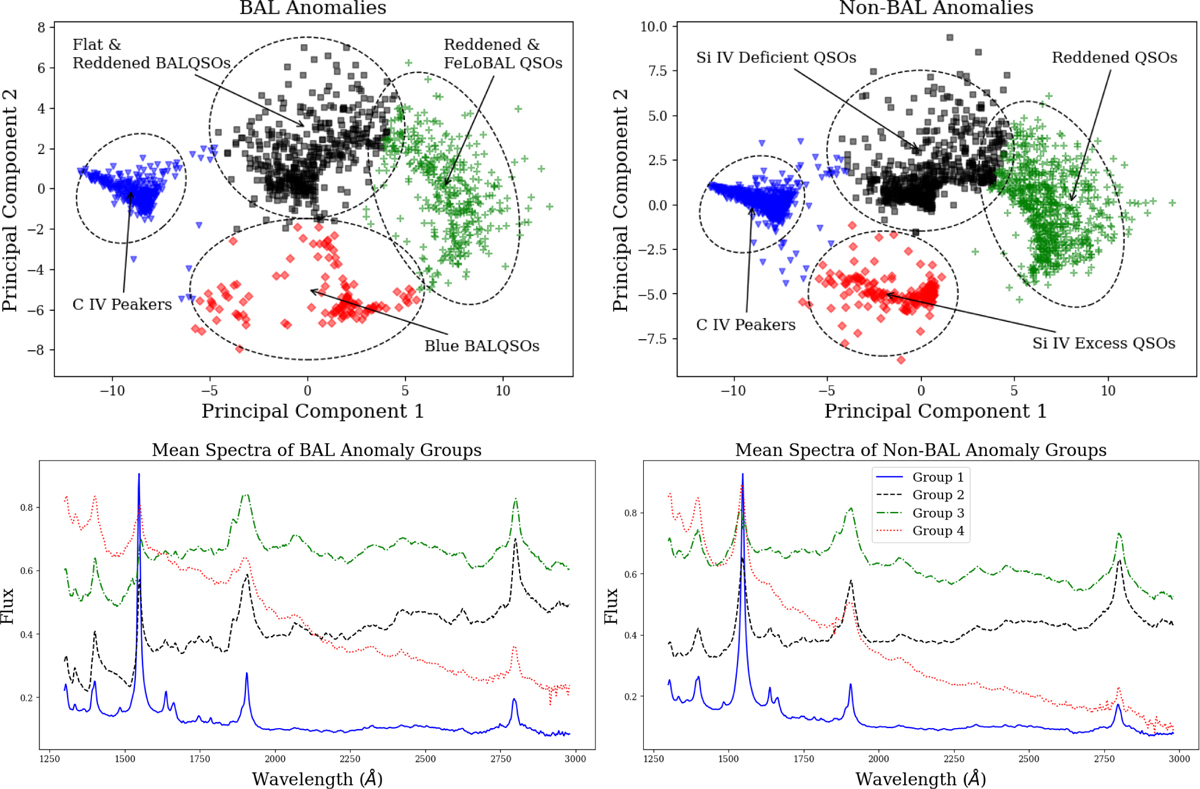
Top: 2D projection (PCA 1 versus PCA 2 coefficients) of the anomalies of the two datasets as divided into four groups each (group 1: blue, group 2: black, group 3: green, group 4: red) in the 20 dimensional PCA hyperspace, by the second k-means clustering applied only on the anomalous quasars. The groups as characterized by further analysis (see Sect. 5) are circled and labelled to reflect the nature of their anomaly. Bottom: mean composite spectrum of each anomaly group for both the datasets. The colors of the spectra correspond to the color of the corresponding group in the top panel.
Current usage metrics show cumulative count of Article Views (full-text article views including HTML views, PDF and ePub downloads, according to the available data) and Abstracts Views on Vision4Press platform.
Data correspond to usage on the plateform after 2015. The current usage metrics is available 48-96 hours after online publication and is updated daily on week days.
Initial download of the metrics may take a while.