Fig. 7
Download original image
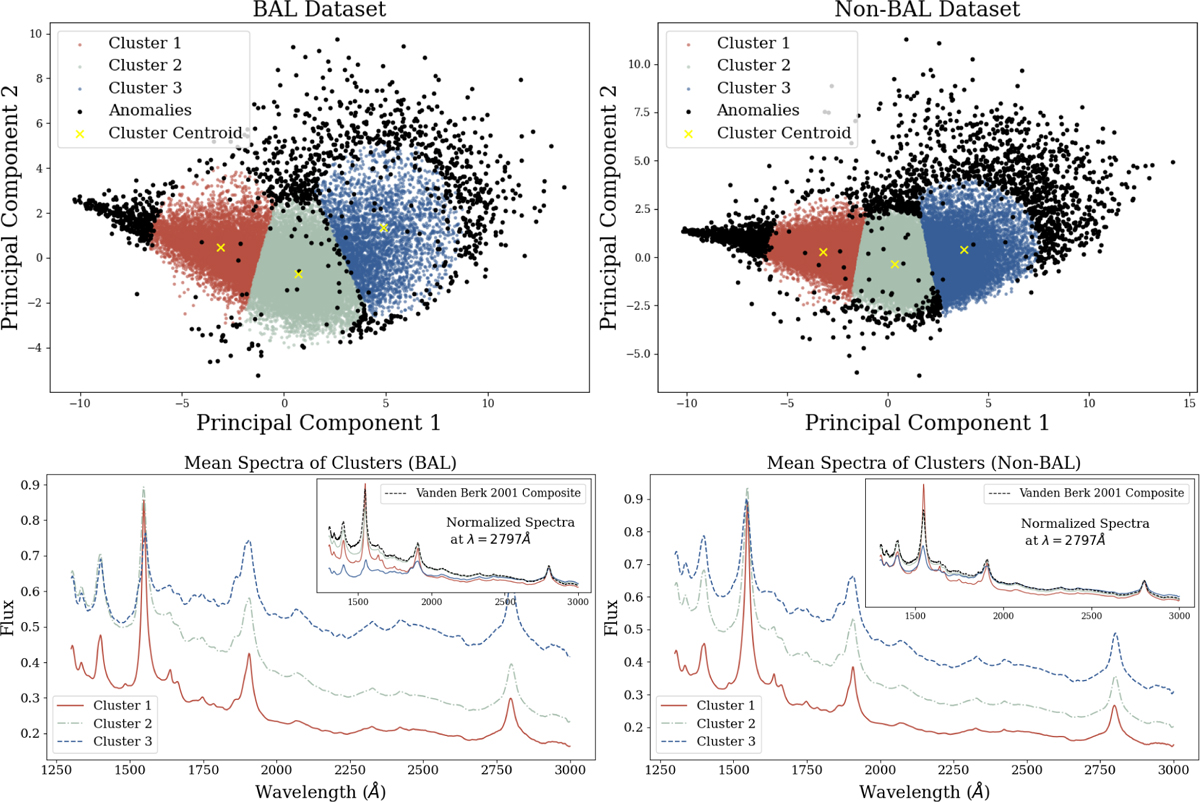
Top: 2D projection (PCA 1 versus PCA 2 coefficients) of the BAL (left) and non-BAL (right) datasets. Each dataset is divided into three clusters (cluster 1: brown, cluster 2: green, cluster 3: blue) within the 20-dimensional PCA hyperspace, using k-means clustering. Quasars classified as anomalous after applying a Q3 + 1.5 × IQR threshold are shown as black scatter points overlayed on top of the cluster members. The cluster centroids are marked by yellow crosses. Bottom: mean composite spectrum for each cluster of the BAL (left) and non-BAL (right) datasets. The color of each spectrum corresponds to the color of the cluster as shown in the top panel. The inset plot shows the mean cluster spectra normalized at λ = 2797 Å with the Vanden Berk et al. (2001) composite. The number of anomalies present in each cluster is given in Table 2.
Current usage metrics show cumulative count of Article Views (full-text article views including HTML views, PDF and ePub downloads, according to the available data) and Abstracts Views on Vision4Press platform.
Data correspond to usage on the plateform after 2015. The current usage metrics is available 48-96 hours after online publication and is updated daily on week days.
Initial download of the metrics may take a while.