Fig. 5
Download original image
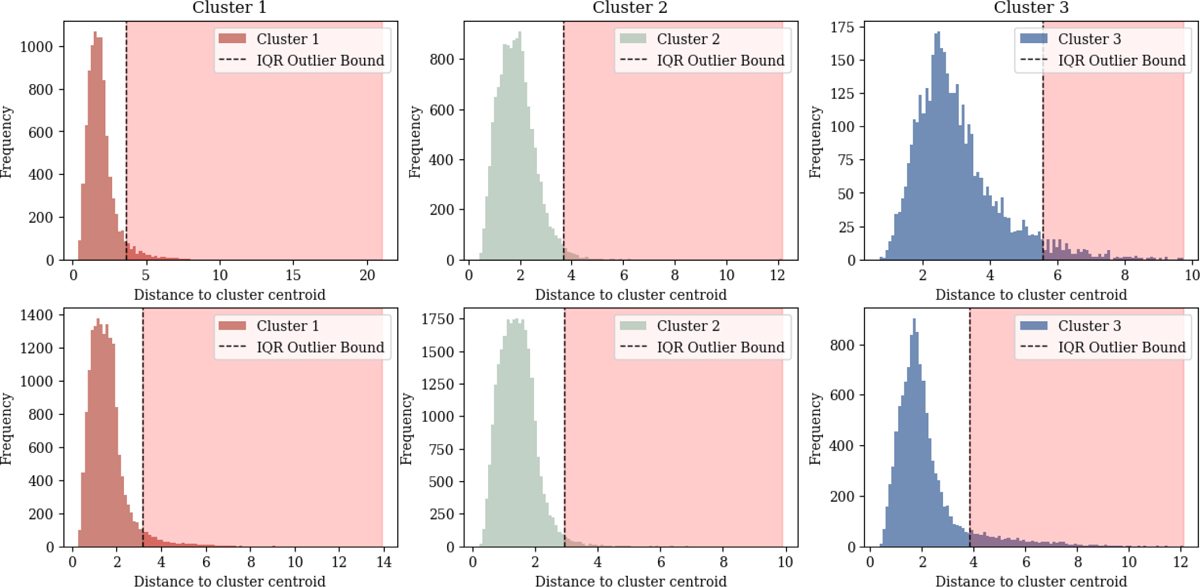
Histograms show the distribution of the Euclidean distance of each point from its respective cluster centroid for the BAL (top panel) and non-BAL (bottom panel) datasets respectively. The red shaded region marks the respective threshold limits (Q3 + 1.5 × IQR; see Sect. 3.1). Quasars falling within the shaded region are identified as anomalous quasars.
Current usage metrics show cumulative count of Article Views (full-text article views including HTML views, PDF and ePub downloads, according to the available data) and Abstracts Views on Vision4Press platform.
Data correspond to usage on the plateform after 2015. The current usage metrics is available 48-96 hours after online publication and is updated daily on week days.
Initial download of the metrics may take a while.