Fig. B.1
Download original image
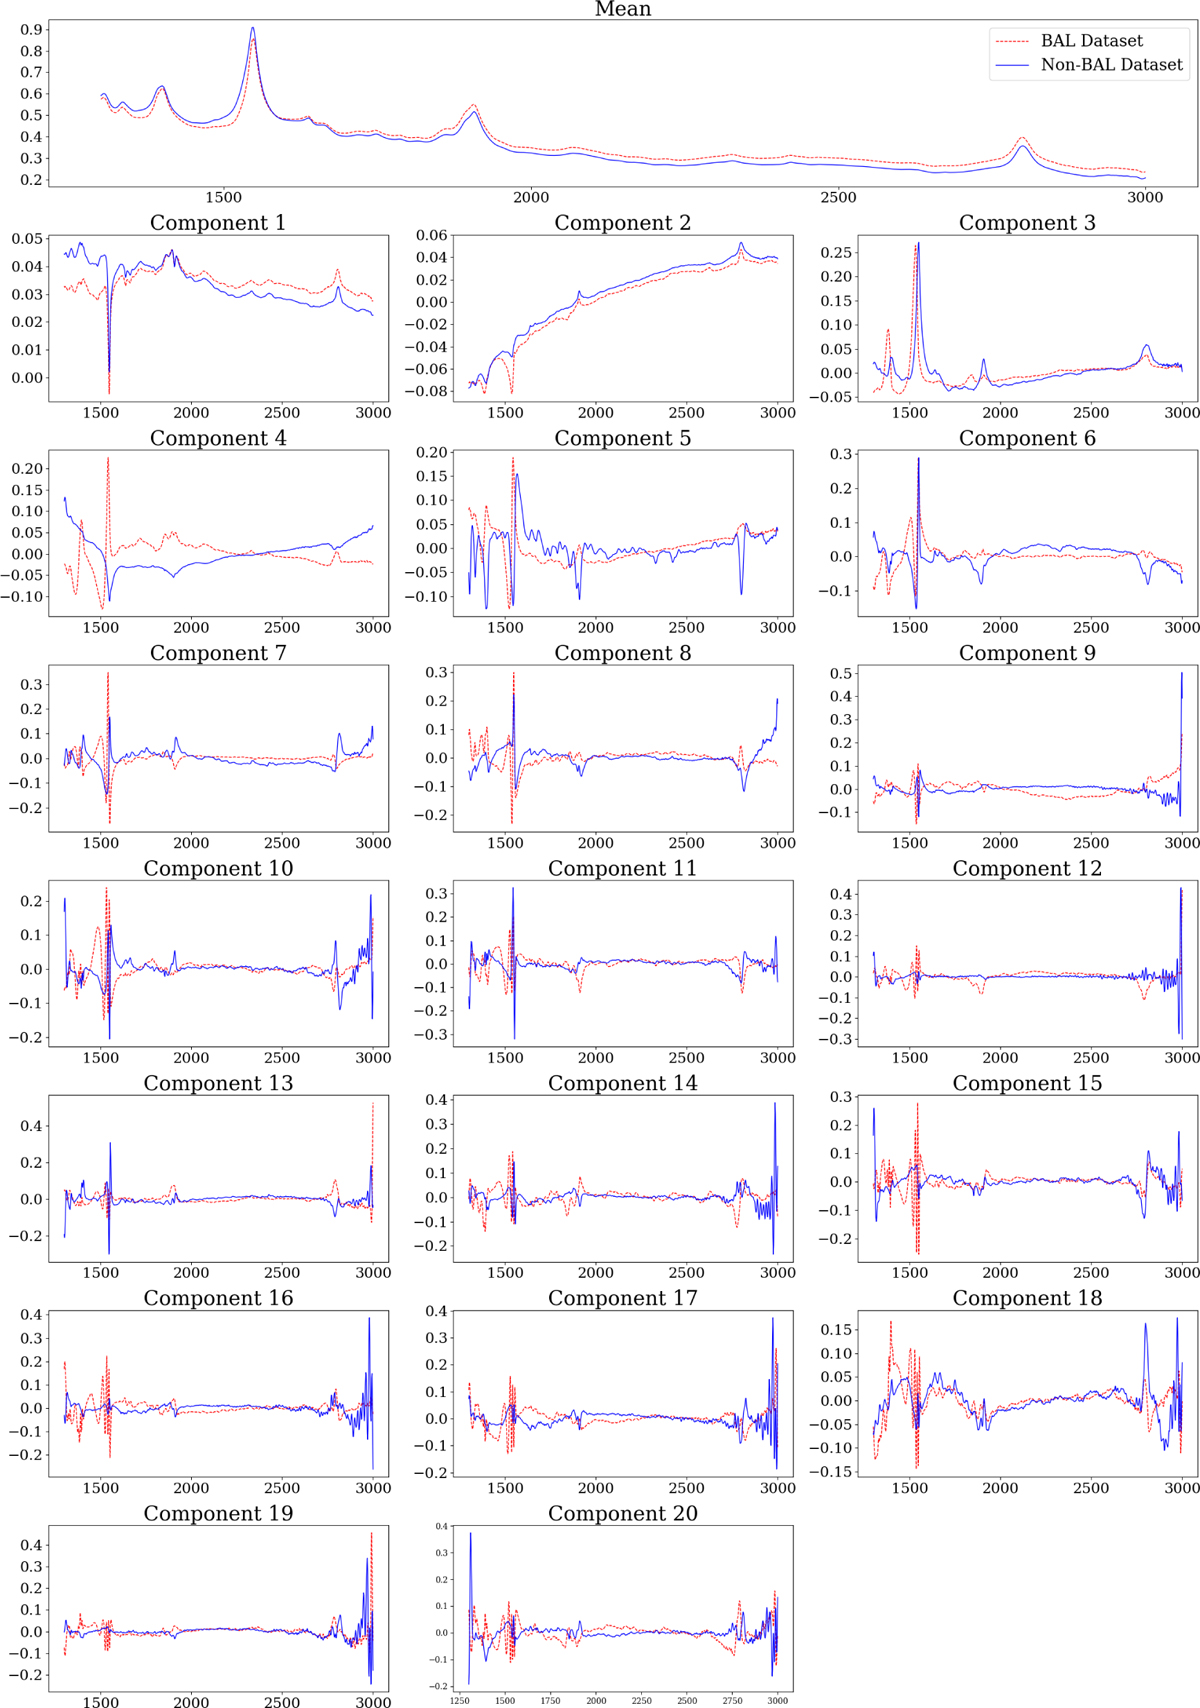
Each of the 20 components of the PCA decomposition shown in each panel (red dashed line for BAL dataset; blue solid line for non-BAL dataset). Each component represents an eigenvector of the 20 component PCA. The first plot on the top depicts the mean spectrum of the total dataset. This mean spectrum is coincident with the Vanden Berk et al. (2001) composite spectrum which reinforces the generalized nature of our selected data sample.
Current usage metrics show cumulative count of Article Views (full-text article views including HTML views, PDF and ePub downloads, according to the available data) and Abstracts Views on Vision4Press platform.
Data correspond to usage on the plateform after 2015. The current usage metrics is available 48-96 hours after online publication and is updated daily on week days.
Initial download of the metrics may take a while.