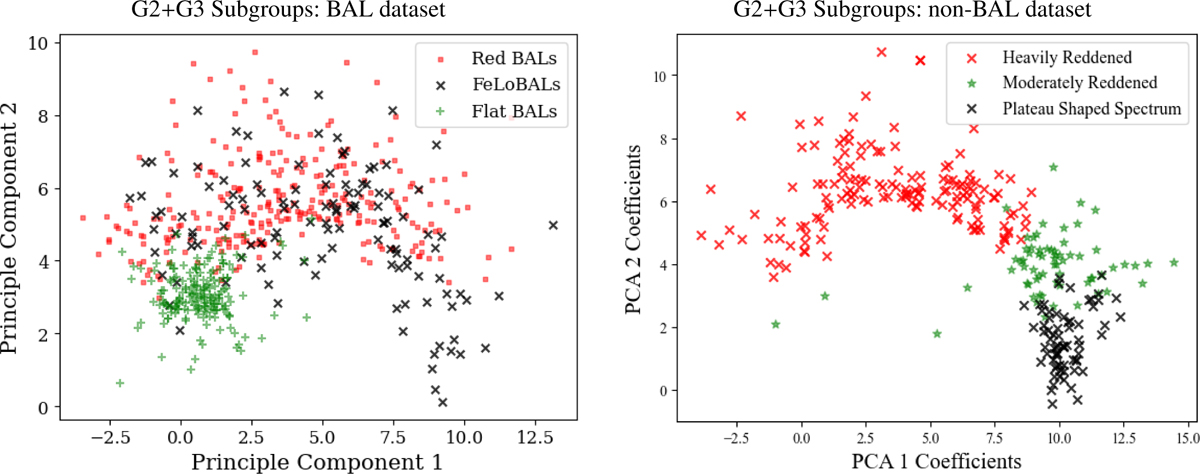
Fig. 12
Download original image
Left: 2D projection of G2+G3 BAL anomalies (using PCA 1 versus PCA 2 coefficients) as grouped into three types by the secondary k-means clustering as discussed in Sect. 3.3. The reddened and FeLoBALs are placed on the upper region with higher PCA 2 coefficients pertaining to largely amount of reddening in their spectra. Flat BALs, usually with a flat spectrum are placed in the middle left region. Right: 2D projection of reddened anomalies (using PCA 1 versus PCA two coefficients) as grouped into three subtypes by the secondary k-means clustering as discussed in Sect. 3.3. The heavily reddened quasars, characterized by steeply sloped spectra, are positioned in the upper region with higher PCA 2 coefficients. Moderately reddened quasars, exhibiting a flat continuum, occupy the middle region. Quasars with plateau-shaped spectra are located in the lower region of the distribution, with the lowest PCA 2 coefficients, due to their overall negative slope.
Current usage metrics show cumulative count of Article Views (full-text article views including HTML views, PDF and ePub downloads, according to the available data) and Abstracts Views on Vision4Press platform.
Data correspond to usage on the plateform after 2015. The current usage metrics is available 48-96 hours after online publication and is updated daily on week days.
Initial download of the metrics may take a while.