Open Access
Fig. 10
Download original image
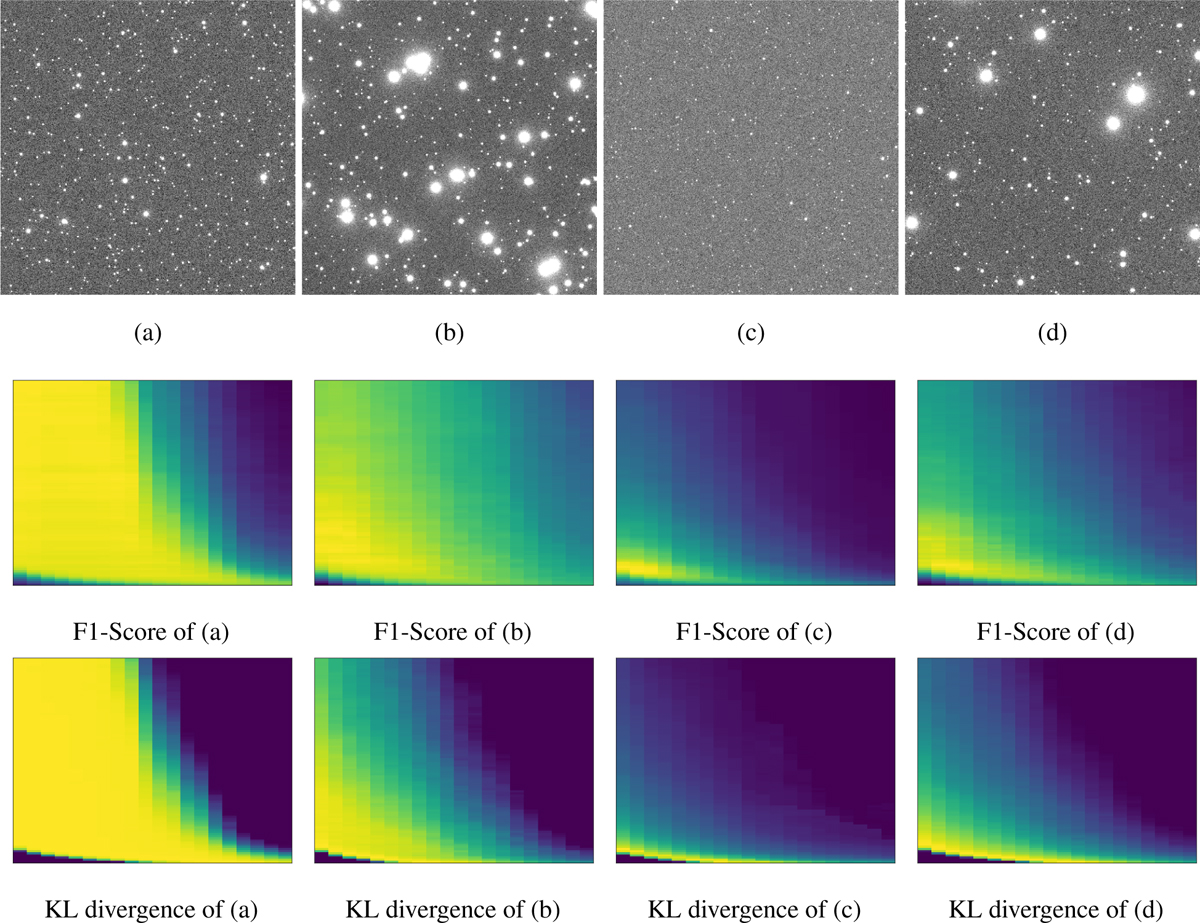
Simulated images generated using various parameters (top panel). The F1-score surface corresponding to these images (middle panel). The bottom panel shows the KL divergence of the corresponding images.
Current usage metrics show cumulative count of Article Views (full-text article views including HTML views, PDF and ePub downloads, according to the available data) and Abstracts Views on Vision4Press platform.
Data correspond to usage on the plateform after 2015. The current usage metrics is available 48-96 hours after online publication and is updated daily on week days.
Initial download of the metrics may take a while.