Fig. 1
Download original image
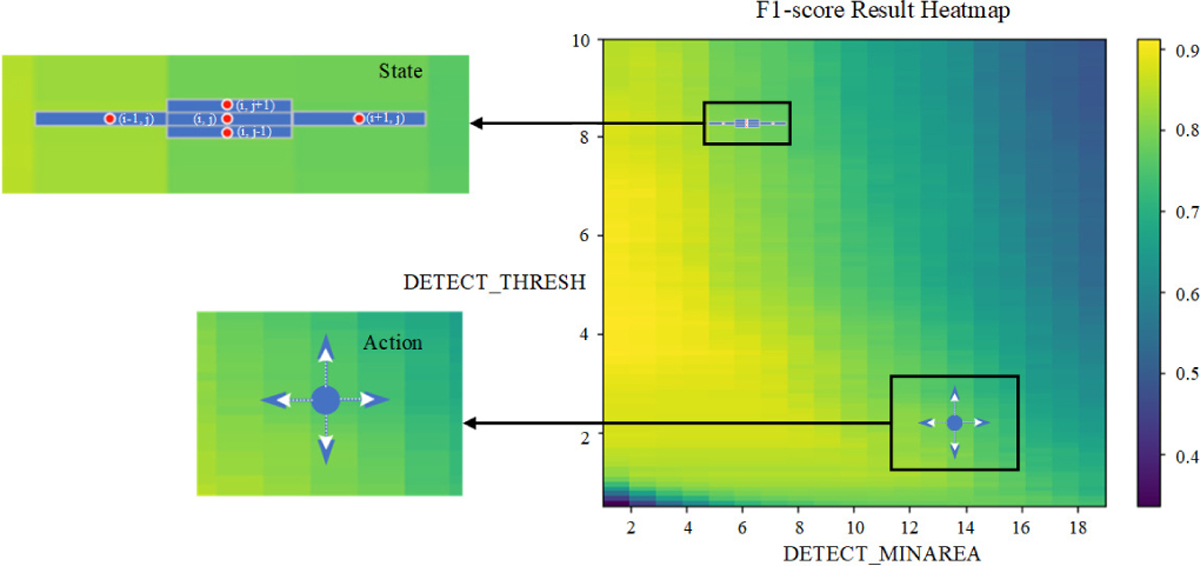
Two-dimensional heat map representing the parameter distribution of the detection threshold (DETECT_THRESH) and the minimally connected regions (DETECT_MINAREA) for the target-detection task in a specific image, thus providing a visual depiction of the state distribution. The depiction of the designed states and actions is presented in the left panel. The current parameter position is denoted as (i, j), and the four adjacent positions are identified as (i+1, j), (i-1, j), (i, j+0.1), and (i, j-0.1).
Current usage metrics show cumulative count of Article Views (full-text article views including HTML views, PDF and ePub downloads, according to the available data) and Abstracts Views on Vision4Press platform.
Data correspond to usage on the plateform after 2015. The current usage metrics is available 48-96 hours after online publication and is updated daily on week days.
Initial download of the metrics may take a while.