Open Access
Fig. B.2
Download original image
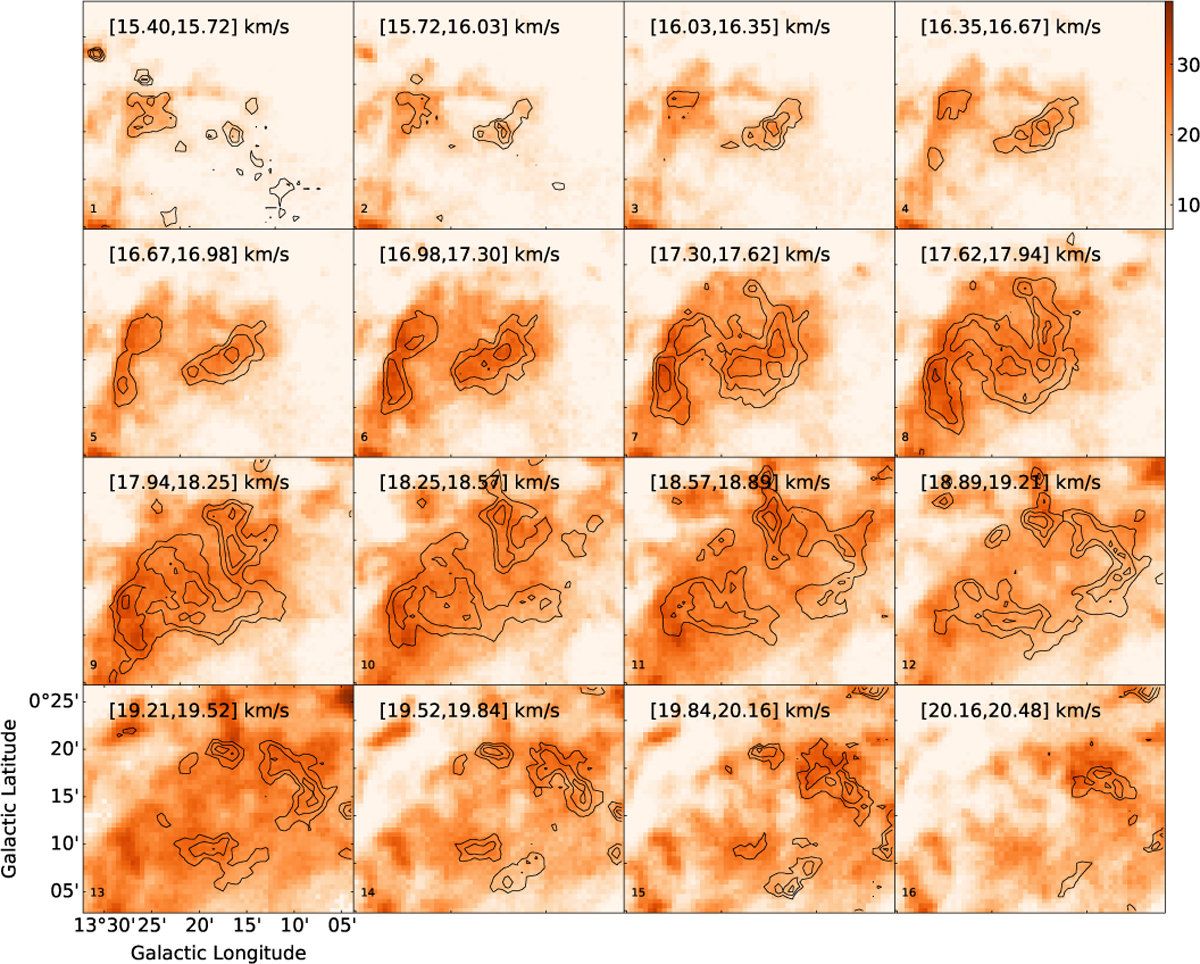
12CO channel maps (background) with overlaid 13CO contours at the levels of 45%–85% of the peak intensity (with steps of 20%). The velocity range is displayed in the upper left corner of each panel.
Current usage metrics show cumulative count of Article Views (full-text article views including HTML views, PDF and ePub downloads, according to the available data) and Abstracts Views on Vision4Press platform.
Data correspond to usage on the plateform after 2015. The current usage metrics is available 48-96 hours after online publication and is updated daily on week days.
Initial download of the metrics may take a while.