Fig. 7
Download original image
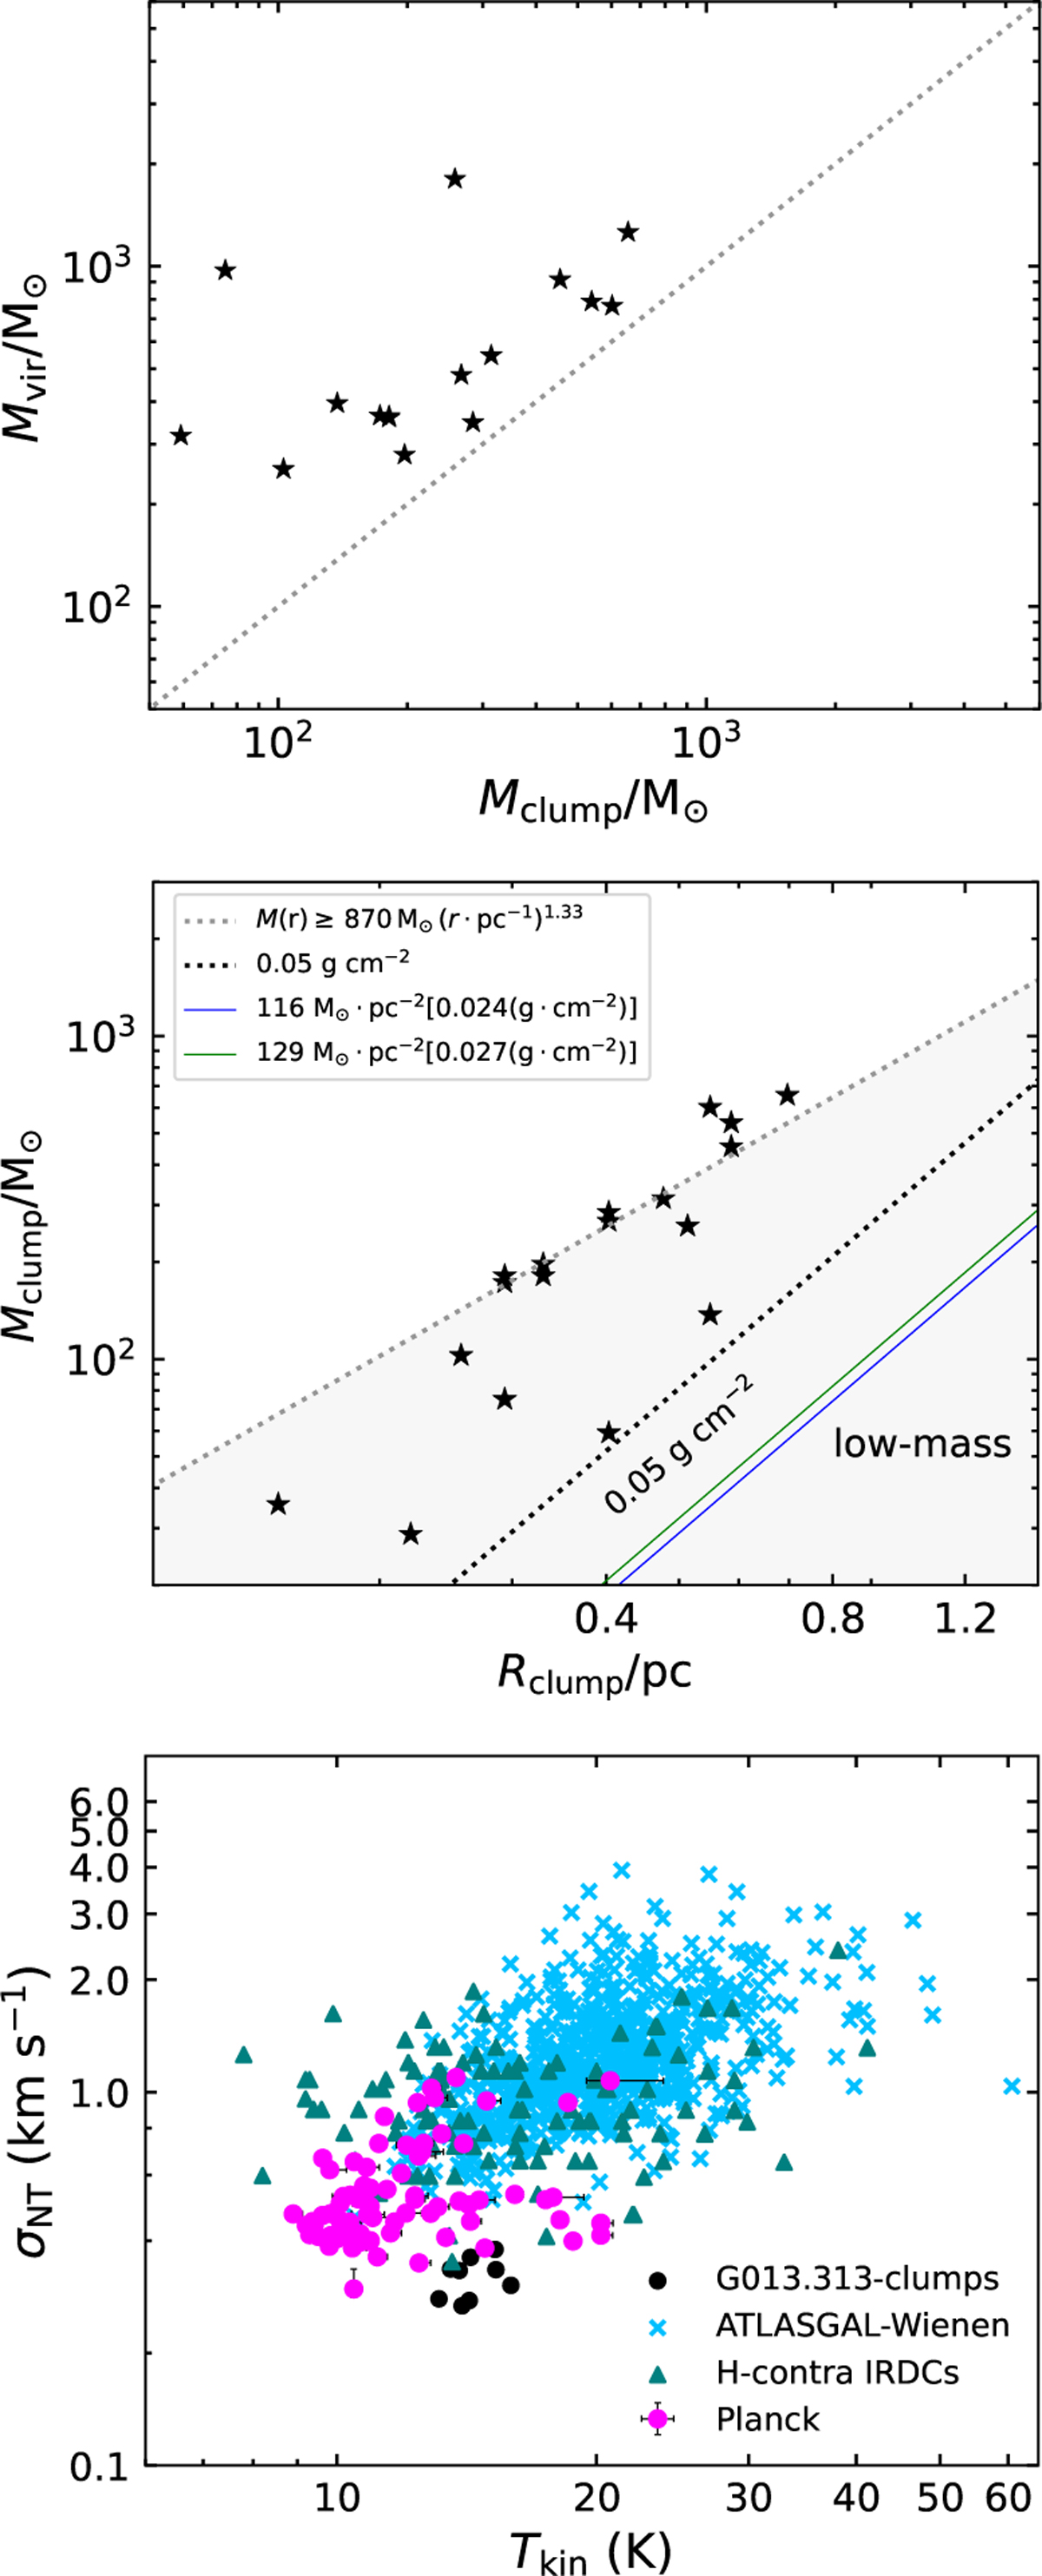
Top panel: Relation graph between Mclump and Mvir. The dashed black line indicates the Mclump = Mvir relation. Middle panel: Clump mass as a function of radius for clumps. The grey area indicates the extent of the low-mass star-forming region. The dotted grey line indicates the threshold for the high-mass star formation M(r) 870 ≥ M⊙ (r · pc−1)1.33 determined by Kauffmann & Pillai (2010). The dotted black line indicates the threshold (0.05 g cm−2) for the high-mass star formation determined by Urquhart et al. (2014b). The solid blue and green lines at the bottom right represent surface density thresholds for ‘efficient’ star formation of 116 M⊙ · pc−2 [0.024 (g ·cm−2)](La et al. 2010; Lombardi et al. 2015) and 129 M⊙ · pc−2 0.027 g · cm−2 (Heiderman et al. 2010). In the plot, data points for clumps are depicted as black stars. Bottom panel: Non-thermal velocity dispersion σNT vs gas kinetic temperature derived from NH3 (1,1) and (2,2).
Current usage metrics show cumulative count of Article Views (full-text article views including HTML views, PDF and ePub downloads, according to the available data) and Abstracts Views on Vision4Press platform.
Data correspond to usage on the plateform after 2015. The current usage metrics is available 48-96 hours after online publication and is updated daily on week days.
Initial download of the metrics may take a while.