Fig. 6
Download original image
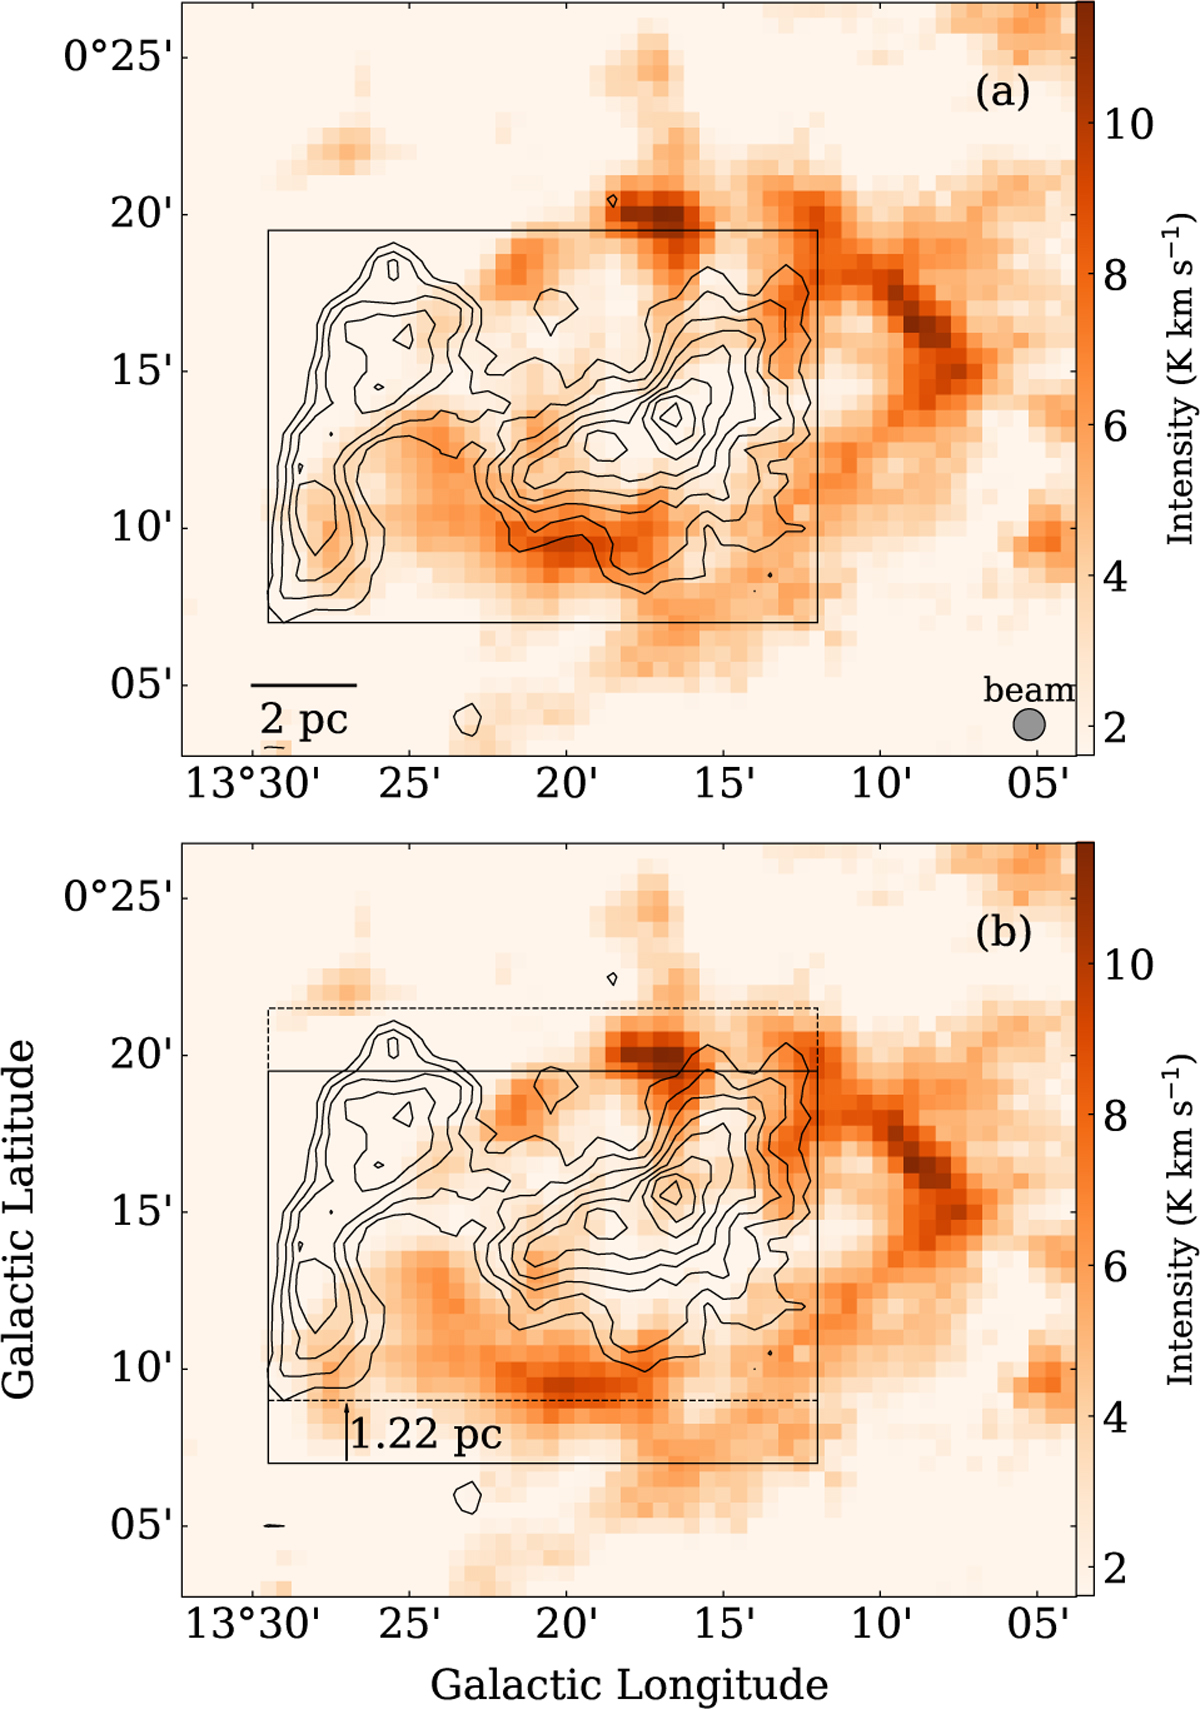
Complementary 13CO distributions of the two velocity components of G013.313. The colour image represents the integrated velocity range of 18.76–20.92 km s−1. Contours correspond to a range of 15.5 to 17.9 km s−1. Contour levels are set at 4.4, 6.0, 7.6, 9.2, 10.8, 12.5, 14.1, and 15.7 K km s−1. The colour image highlights the red-shifted cloud, whereas the contours depict the blue-shifted cloud. Panels (a) and (b) show the maps before and after the displacement of the blue-shifted cloud contours, respectively.
Current usage metrics show cumulative count of Article Views (full-text article views including HTML views, PDF and ePub downloads, according to the available data) and Abstracts Views on Vision4Press platform.
Data correspond to usage on the plateform after 2015. The current usage metrics is available 48-96 hours after online publication and is updated daily on week days.
Initial download of the metrics may take a while.