Fig. 5
Download original image
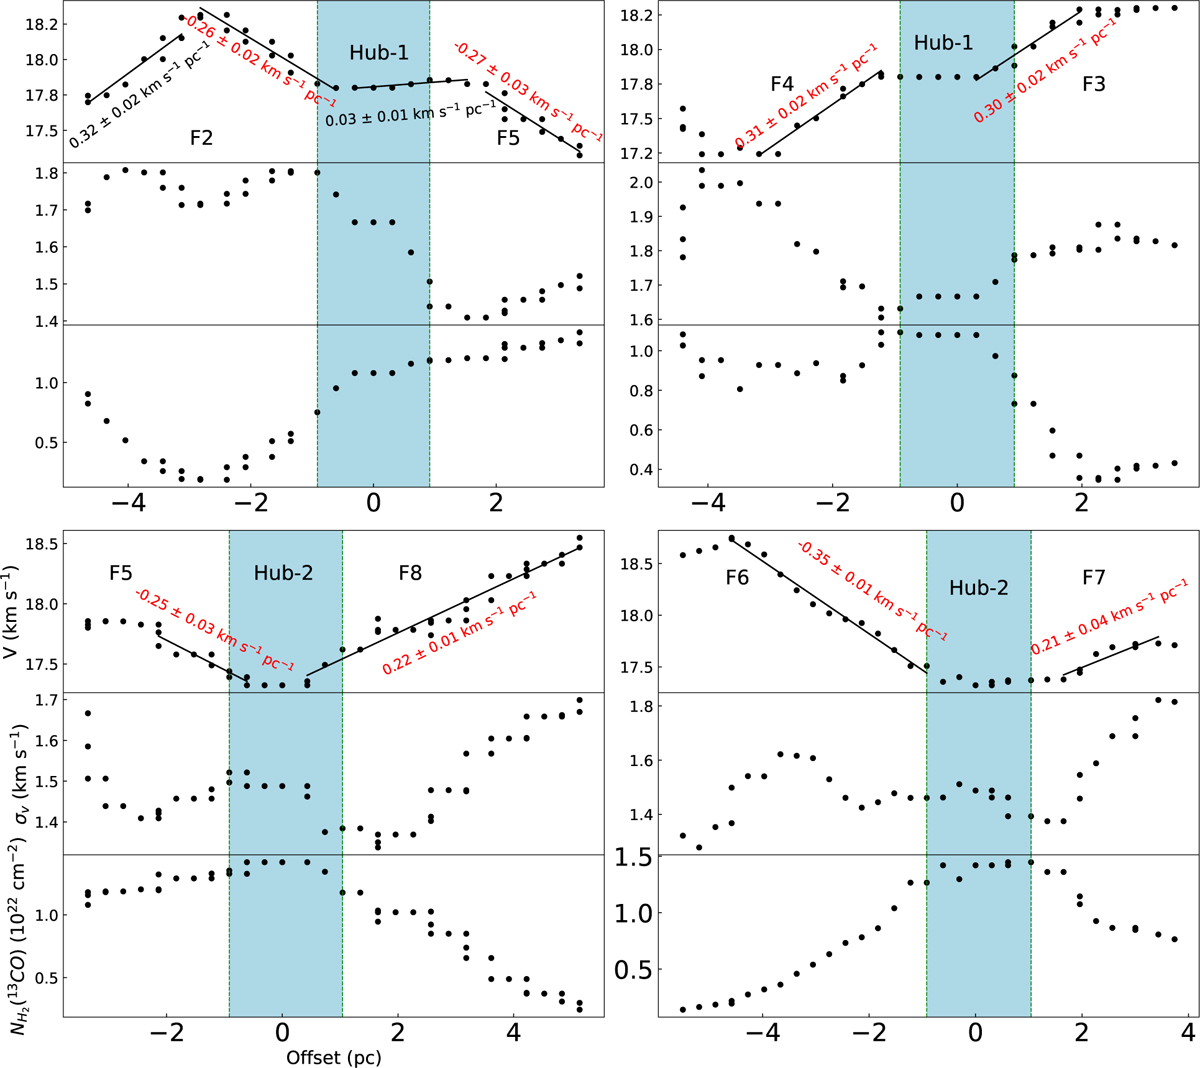
Distributions of velocity, velocity dispersion, and column density variations along the filament skeletons marked in Fig. 1. The top-left panel shows the profiles along F2–F5, while the top-right panel displays F4–F3. The middle-left panel represents F5–F8, and the middle-right panel corresponds to F6–F7. The direction of each profile follows the arrows shown in the Fig. 1a. The figure also highlights the approximate regions of Hub-1 and Hub-2, derived from the intensity distribution in Fig. 1b.
Current usage metrics show cumulative count of Article Views (full-text article views including HTML views, PDF and ePub downloads, according to the available data) and Abstracts Views on Vision4Press platform.
Data correspond to usage on the plateform after 2015. The current usage metrics is available 48-96 hours after online publication and is updated daily on week days.
Initial download of the metrics may take a while.