Fig. 4
Download original image
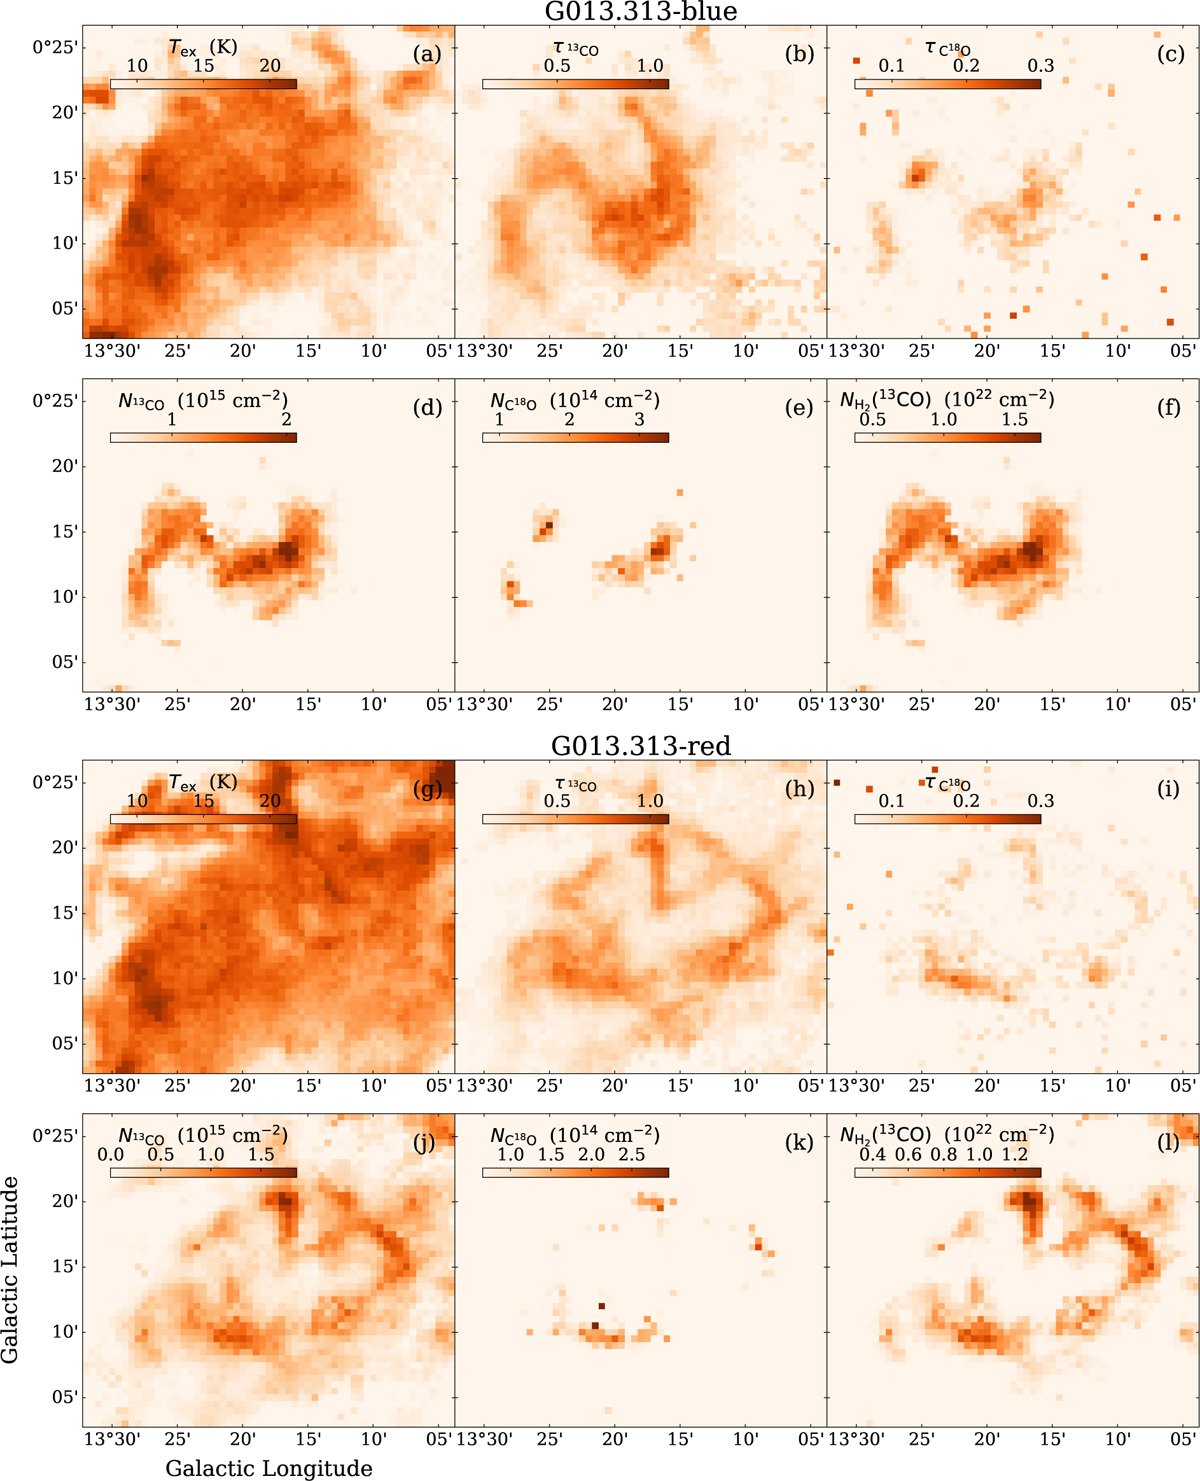
Distribution of physical parameters in the G013.313-blue region: (a) CO-based excitation temperature map derived from 12CO. (b) and (c) Optical depth maps of 13CO and C18O. (d) and (e) column Density maps of 13CO and C18O. (f) Hydrogen molecular column density; Distribution of physical parameters in G013.313-red. (g) CO-based excitation temperature map derived from 12CO. (h) and (i) Optical depth maps of 13CO and C18O. (j) and (k) column Density maps of 13CO and C18O. (l) hydrogen molecular column density.
Current usage metrics show cumulative count of Article Views (full-text article views including HTML views, PDF and ePub downloads, according to the available data) and Abstracts Views on Vision4Press platform.
Data correspond to usage on the plateform after 2015. The current usage metrics is available 48-96 hours after online publication and is updated daily on week days.
Initial download of the metrics may take a while.