Fig. 3
Download original image
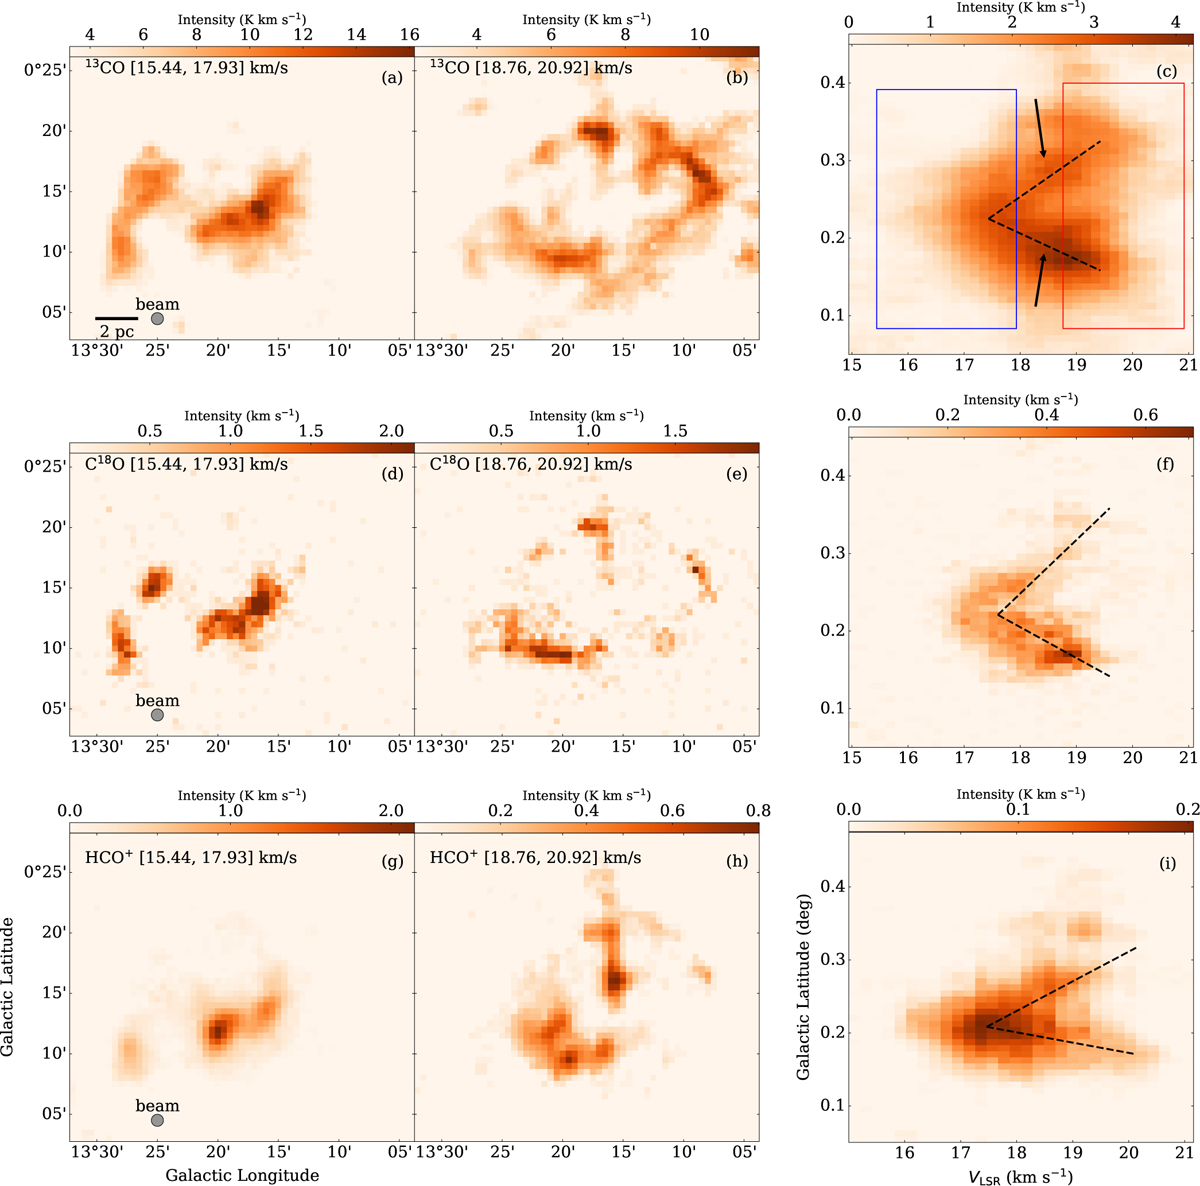
Integrated intensity maps of the blue and red clouds are displayed in panels (a, b, d, e, g, h), with the velocity range displayed in the upper left corner of each panel. Corresponding P–V diagrams with latitude-velocity data integrated across a longitude range of l = 13.06° to l = 13.54° in panels (c, f, i). The upper three panels (a–c) illustrate the 13CO emission line, while the middle three panels (d–f) depict the C18O emission line, and the lower three panels (g–i) present the HCO+ emission line. Each panel includes the integration ranges indicated in the bottom right corner. V-shaped features are showing in the P–V diagrams (c, f, i), and bridging features are highlighted with arrows in panel (c). Additionally, panel (c) shows the approximate velocity ranges of the two components, with the G013.313-blue component marked by a blue box and the G013.313-red component by a red box.
Current usage metrics show cumulative count of Article Views (full-text article views including HTML views, PDF and ePub downloads, according to the available data) and Abstracts Views on Vision4Press platform.
Data correspond to usage on the plateform after 2015. The current usage metrics is available 48-96 hours after online publication and is updated daily on week days.
Initial download of the metrics may take a while.