Fig. 2
Download original image
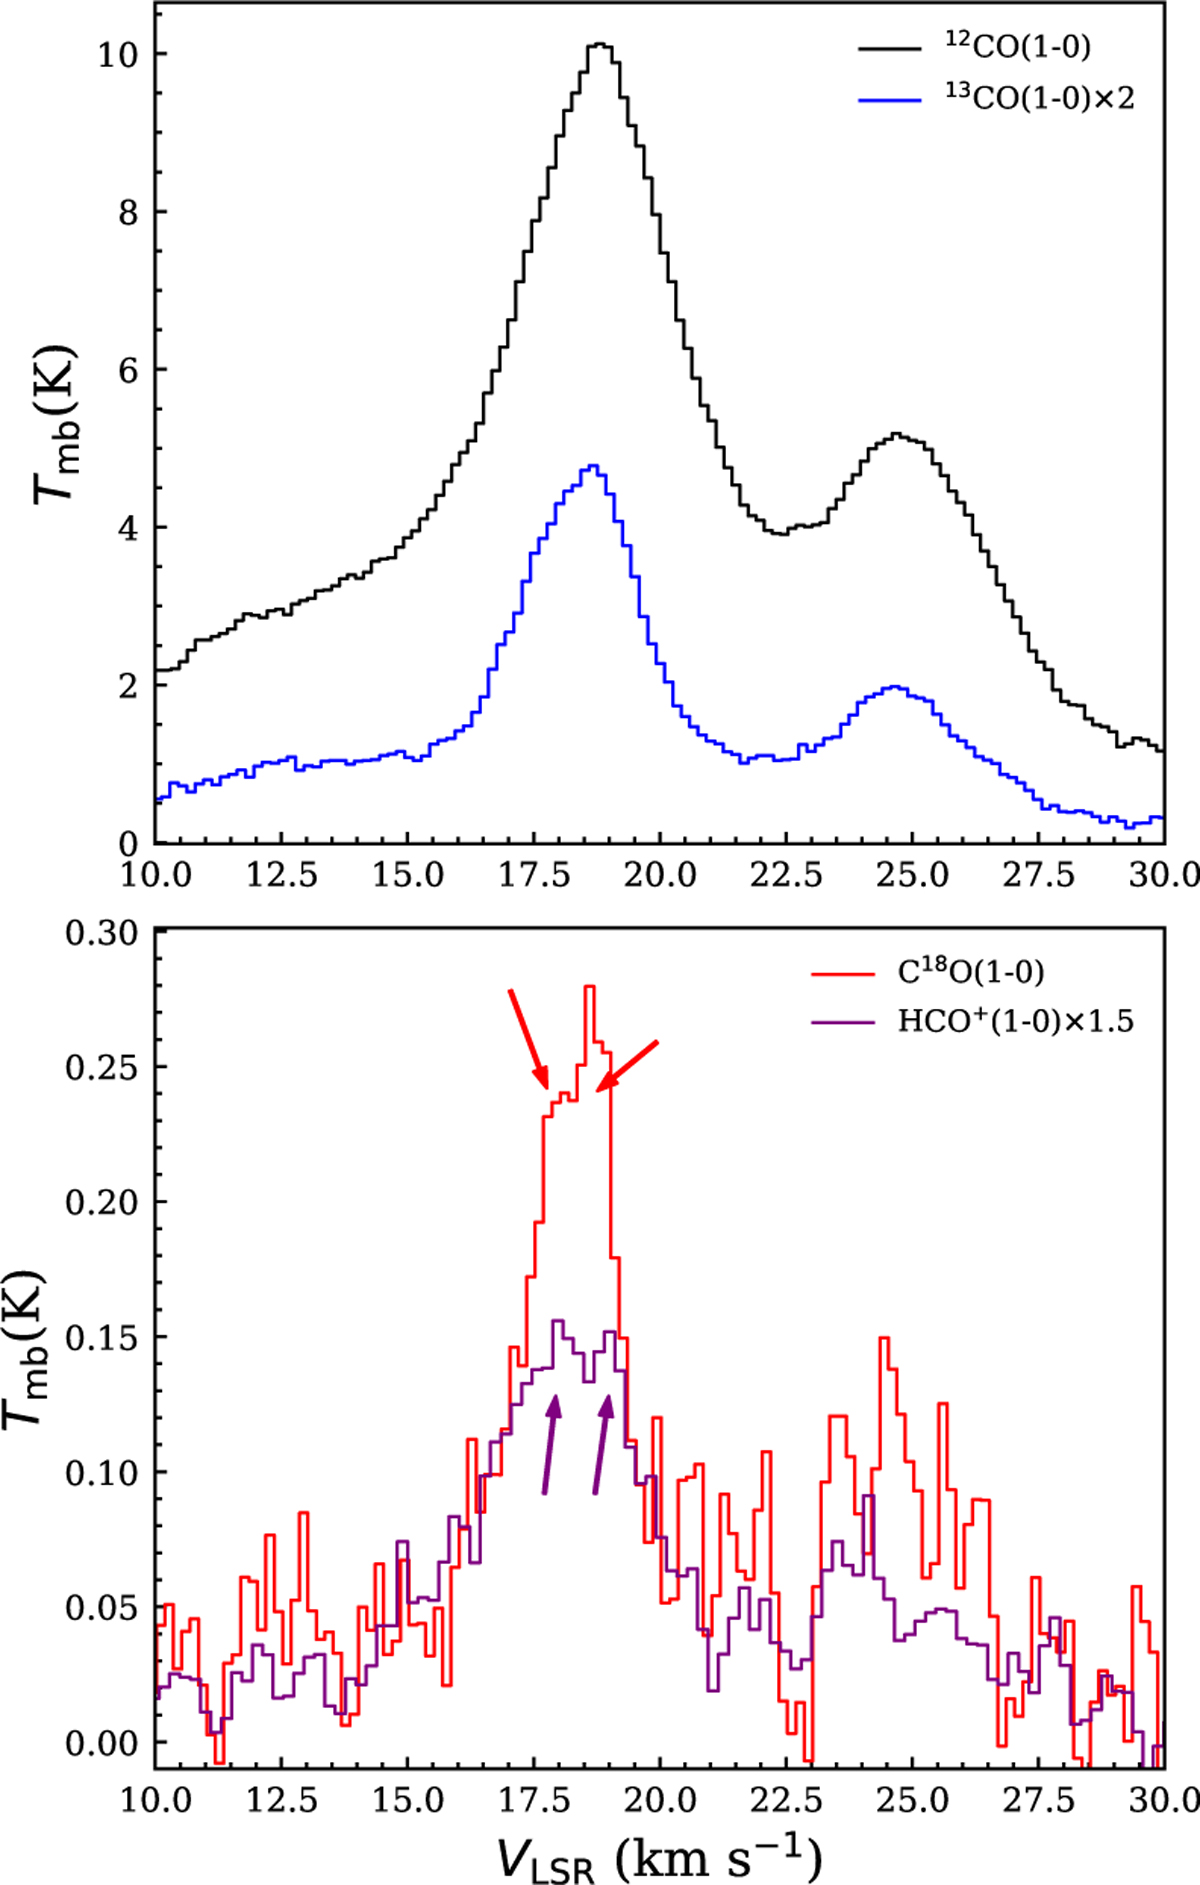
Spectra for the entire mapped area of the G013.313 region (see Fig. 1b). The upper panel shows the average spectra of 12CO (black) and 13CO (blue), while the lower panel displays C18O (red) and HCO+ (purple). In the lower panel, arrows indicate the approximate positions of the two peaks observed in the C18O and HCO+ lines (see also Fig. 1c).
Current usage metrics show cumulative count of Article Views (full-text article views including HTML views, PDF and ePub downloads, according to the available data) and Abstracts Views on Vision4Press platform.
Data correspond to usage on the plateform after 2015. The current usage metrics is available 48-96 hours after online publication and is updated daily on week days.
Initial download of the metrics may take a while.