Fig. E.1
Download original image
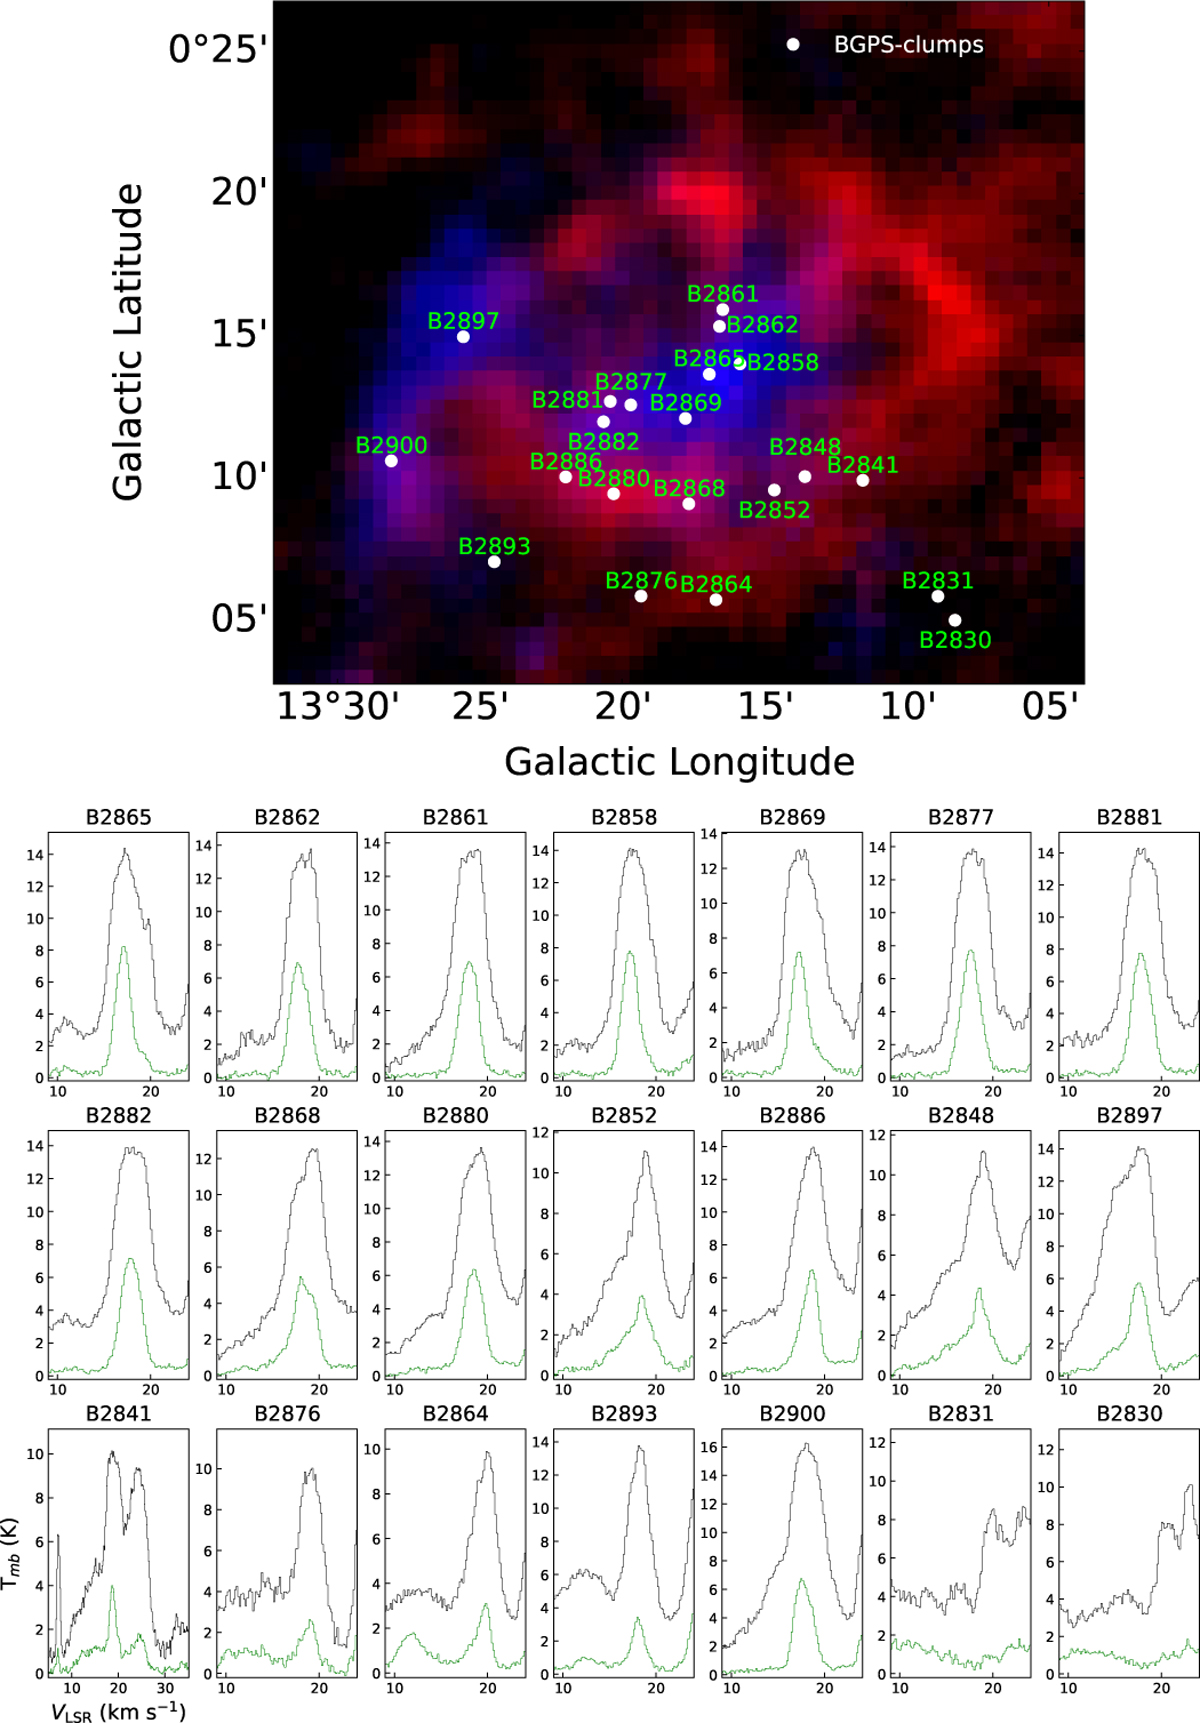
Top panel: Two-colour composite image of G013.313 employs 13CO data, with blue indicating the blue-shifted cloud and red representing the red-shifted cloud. The white circles mark the BGPS clumps, and each clump name is placed nearby in green text. Bottom panel: The average 12CO and 13CO spectral profiles of the clumps. Each subplot is labelled with its clump ID.
Current usage metrics show cumulative count of Article Views (full-text article views including HTML views, PDF and ePub downloads, according to the available data) and Abstracts Views on Vision4Press platform.
Data correspond to usage on the plateform after 2015. The current usage metrics is available 48-96 hours after online publication and is updated daily on week days.
Initial download of the metrics may take a while.