Fig. C.1
Download original image
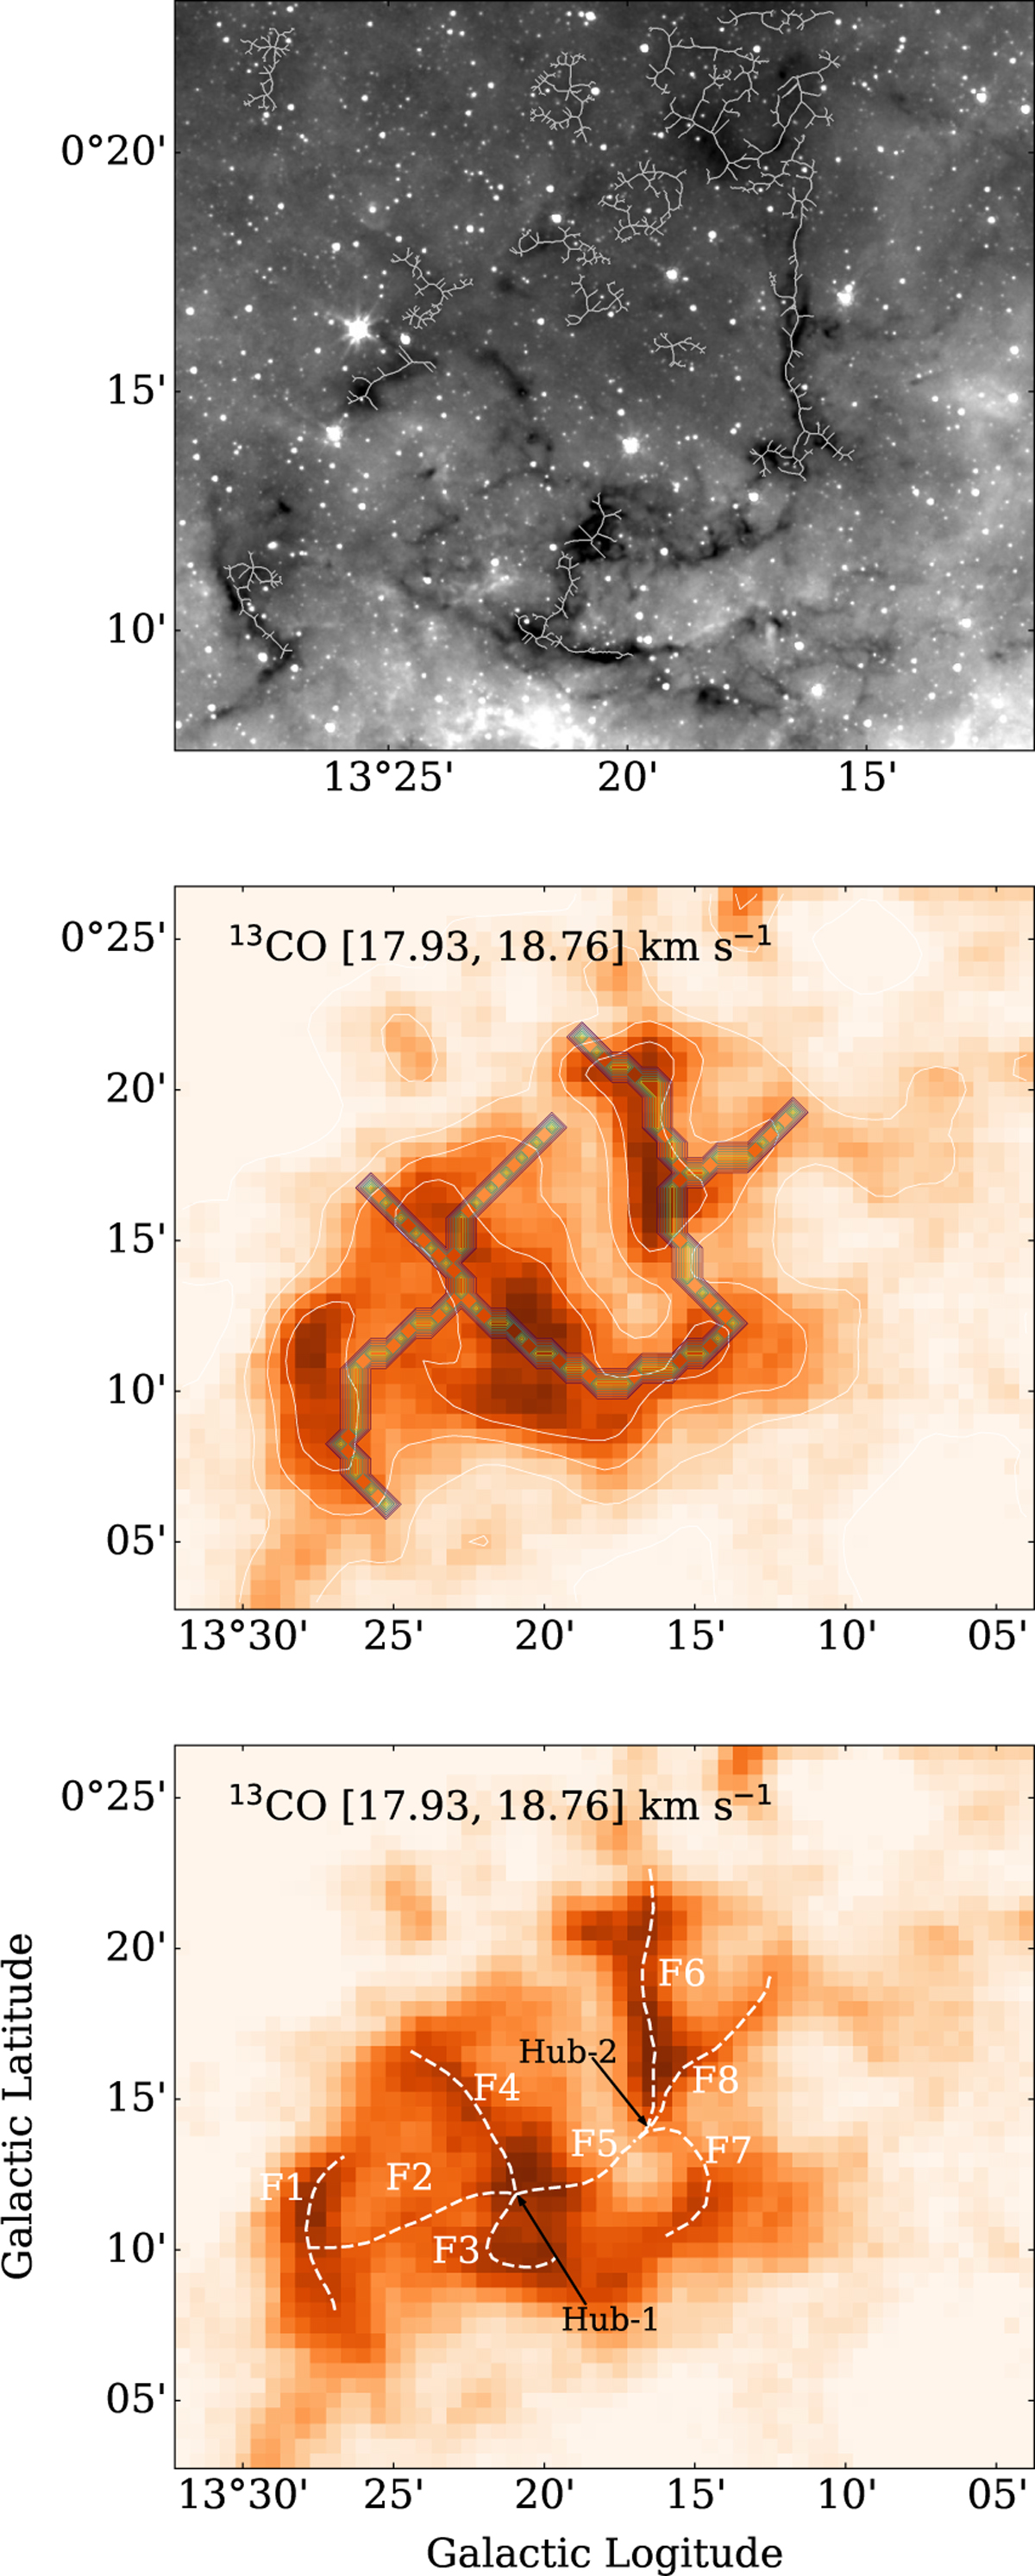
Filamentary structures identified from Spitzer 8 µm and 13CO(1-0) data. Top Panel: Filamentary structures identified using Spitzer IRAC 8 µm emission with the FilFinder algorithm. Middle Panel: Filamentary structures identified using 13CO (1-0) data in the velocity range of 17.93–18.76 km s−1. Bottom Panel: Manually refined filament paths overlaid on the 13CO(1-0) integrated intensity map (17.93–18.76 km s−1), with HFS-1 and HFS-2 marked.
Current usage metrics show cumulative count of Article Views (full-text article views including HTML views, PDF and ePub downloads, according to the available data) and Abstracts Views on Vision4Press platform.
Data correspond to usage on the plateform after 2015. The current usage metrics is available 48-96 hours after online publication and is updated daily on week days.
Initial download of the metrics may take a while.