Fig. 1
Download original image
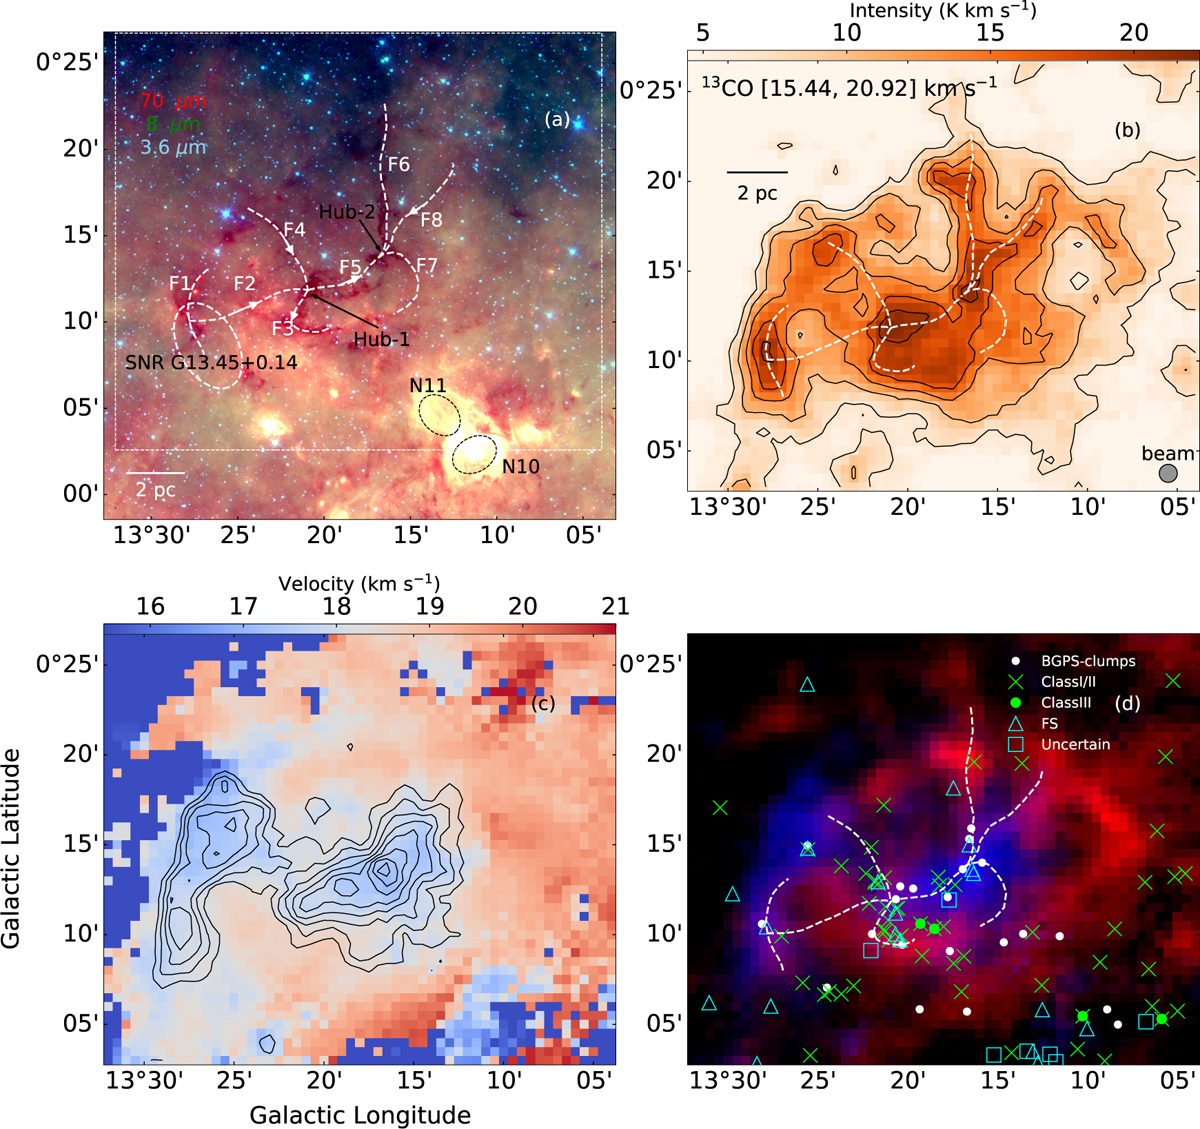
(a) Three-colour composite image of G013.313. Blue, green, and red images show the Spitzer IRAC 3.6, 8 (Werner et al. 2004), and Hi-GAL 70 µm (Pilbratt et al. 2010) data, respectively. The white box with dashed lines shows the target region of the present work. (b) A map of integrated 13CO (J = 1–0) covering the velocity range from 15.44 to 20.92 km s−1 is shown for the area within the white box in panel (a). Contours correspond to 6.7, 10.0, 13.4, 16.7, and 20.1 K km s−1. (c) 13CO, velocity map (moment-1) of the G013.313 region. Contours correspond to a velocity range of 15.44 to 17.93 km s−1. The contour levels are set at 4.4, 6.0, 7.6, 9.2, 10.8, 12.5, 14.1, and 15.7 K km s−1. (d) The two-colour composite image of G013.313 employs 13CO data, with blue indicating the blue-shifted cloud and red representing the red-shifted cloud. The white circles mark the BGPS clumps. Green signs indicate the YSOs identified by Kuhn et al. (2021). Crosses represent Class I/II YSOs, while circles denote Class III YSOs. Triangles and squares indicate sources with flat spectral energy distributions and uncertain YSOs, respectively. Dashed white lines display the filament paths identified in Appendix C.
Current usage metrics show cumulative count of Article Views (full-text article views including HTML views, PDF and ePub downloads, according to the available data) and Abstracts Views on Vision4Press platform.
Data correspond to usage on the plateform after 2015. The current usage metrics is available 48-96 hours after online publication and is updated daily on week days.
Initial download of the metrics may take a while.