Fig. 8
Download original image
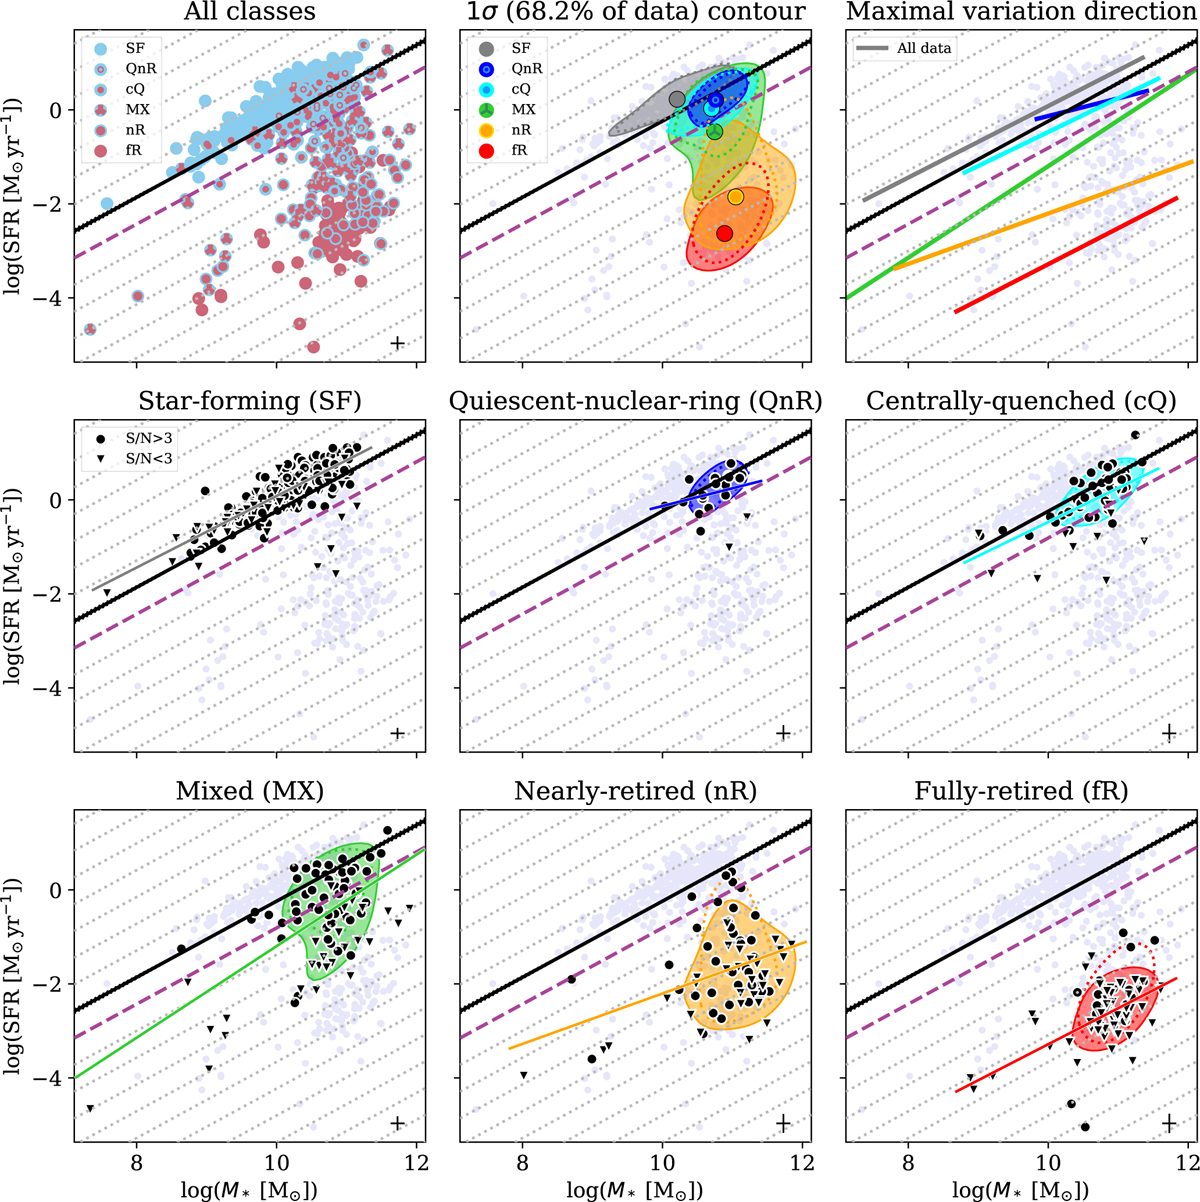
Diagram of SFR-M* from the iEDGE in different representations. Upper left: individual data points are drawn with markers that reflect the WHα bi-dimensional distribution across the galaxy disc. Here, blue shows regions where WHα > 6 Å, while red shows regions where WHα < 3 Å. Upper middle and lower panels: full (dotted) contours encompass 68.2% (1σ) of the data points in a given quenching stage for all galaxies (CO-detected galaxies only). Upper right and lower panels: direction defined by the Bayesian linear regression performed by linmix for the data points in each quenching stage is shown. In the lower panels, the distribution of data in a given quenching stage is highlighted. Additionally, CO-detected galaxies are shown with circles, while triangles indicate galaxies for which an upper limit in the CO luminosity is used. Across the panels, the black solid line shows the SFMS fit from Cano-Díaz et al. (2016) and the purple dashed line is the green valley “boundary” defined in C20, which is located 3σ (equal to 0.20 dex as in Cano-Díaz et al. 2016) below the SFMS. Dotted lines are also spaced of 3σ from each other. Galaxies in the various quenching stages span different regions of the SFR-M* diagram.
Current usage metrics show cumulative count of Article Views (full-text article views including HTML views, PDF and ePub downloads, according to the available data) and Abstracts Views on Vision4Press platform.
Data correspond to usage on the plateform after 2015. The current usage metrics is available 48-96 hours after online publication and is updated daily on week days.
Initial download of the metrics may take a while.