Fig. 7
Download original image
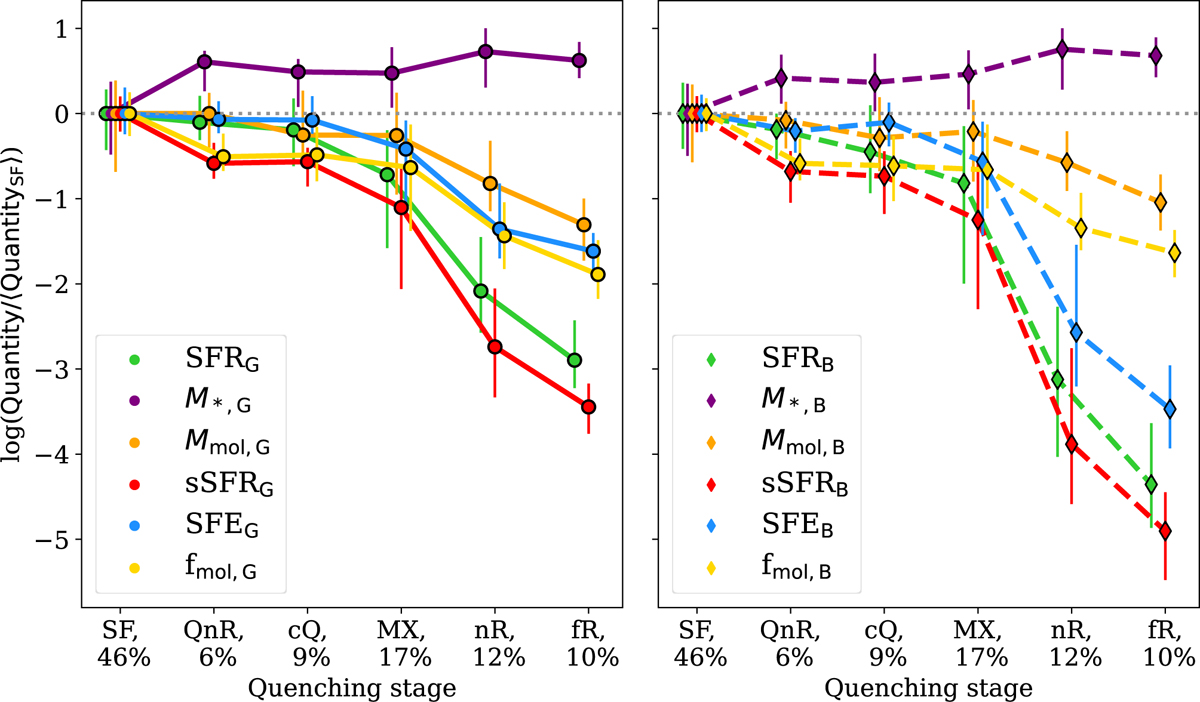
Flaring plots (see text for additional details) of several quantities related to the star formation process (star formation rate, SFR, green; stellar mass, M*, purple; molecular gas mass, Mmol, orange; specific star formation rate, sSFR, red; star formation efficiency, SFR, cyan; molecular gas fraction, fmol, yellow). In the left panel, global quantities are considered, and in the right panel, beam quantities. For these analyses, we calculated the median (circles for global quantities and diamonds for beam quantities) and interquartile range (coloured bars) of the distribution of a given quantity and for a given quenching stage divided by the quantity median from the SF group. Full (global quantities) and dashed (beam quantities) are drawn to guide the eye across the quenching stages. Additionally, we used only CO-detected galaxies (S/N > 3), and the percentage of the galaxies in a given quenching stage compared to the total sample used in this analysis is indicated in the x-axis labels. All properties (except sSFR) appear to decrease, on average, from the SF to the fR stages. However, the decrement of SFR (and relative quantities) is more significant (especially in the centre of the galaxies).
Current usage metrics show cumulative count of Article Views (full-text article views including HTML views, PDF and ePub downloads, according to the available data) and Abstracts Views on Vision4Press platform.
Data correspond to usage on the plateform after 2015. The current usage metrics is available 48-96 hours after online publication and is updated daily on week days.
Initial download of the metrics may take a while.