Fig. 5
Download original image
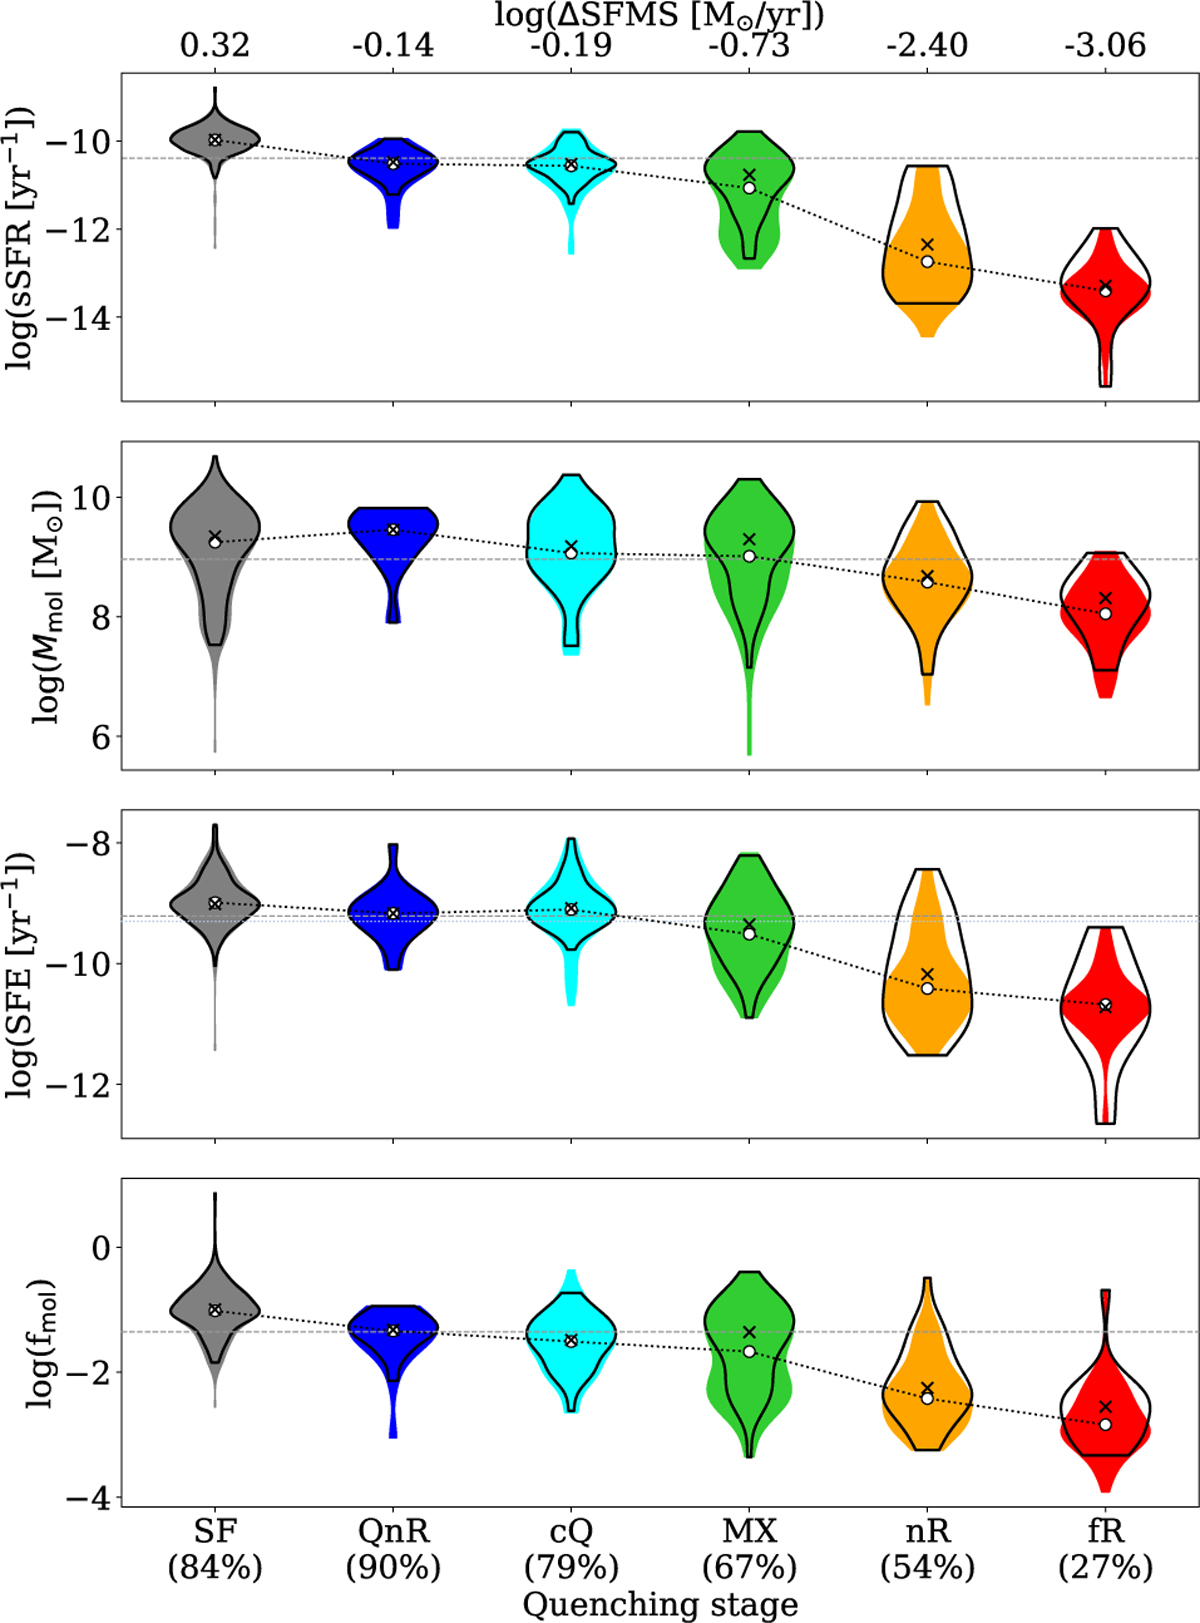
Violin plot representations of sSFR, Mmol, SFE, and fmol of the observed iEDGE galaxies grouped into quenching stages. Horizontal dashed lines show the sample medians, while the white circle indicates the medians for each quenching stage (see also Table 2). Transparent violins show the distributions of the properties, including only CO detection (S/N>3), and the respective median is indicated with a black cross. In addition, classes are ordered considering the median ΔSFMS. At the bottom, the percentage of CO detections within a given class is shown. Generally, property distributions from detections and CO measurement upper limits trace well the distributions from CO-detected targets only. While SFE, on average, appears quite constant across the first quenching stages (SF, QnR, and cQ) to drop drastically afterward, fmol shows a continued decrease from the SF to the fR class.
Current usage metrics show cumulative count of Article Views (full-text article views including HTML views, PDF and ePub downloads, according to the available data) and Abstracts Views on Vision4Press platform.
Data correspond to usage on the plateform after 2015. The current usage metrics is available 48-96 hours after online publication and is updated daily on week days.
Initial download of the metrics may take a while.