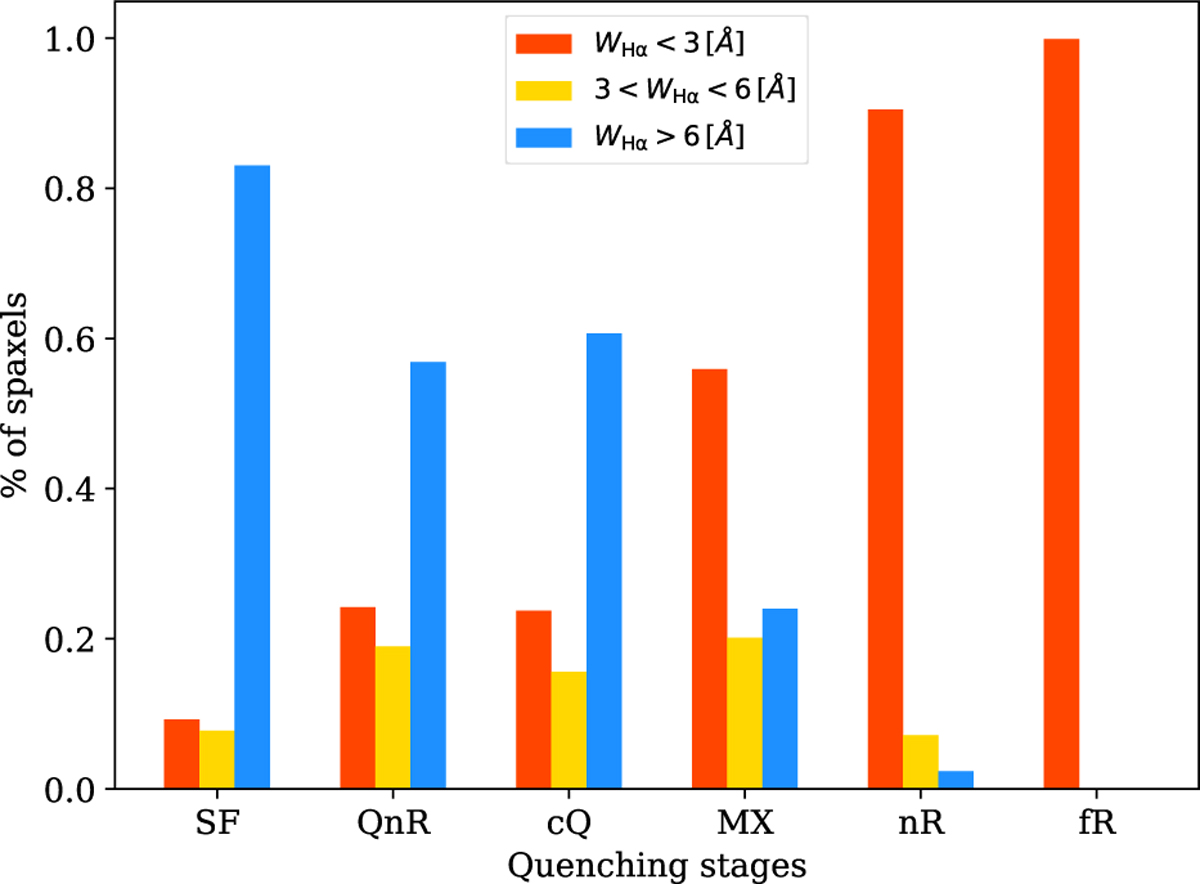
Fig. 3
Download original image
Percentage of spaxels dominated by star formation (blue), by diffuse gas (yellow), or quenched (red) across non-active galaxies at a given quenching stage. The number of spaxels is calculated with 2 Re where QueStNA classification is defined. Crossing the green valley (roughly spanned by the MX group), retired regions become dominant over the star-forming regions.
Current usage metrics show cumulative count of Article Views (full-text article views including HTML views, PDF and ePub downloads, according to the available data) and Abstracts Views on Vision4Press platform.
Data correspond to usage on the plateform after 2015. The current usage metrics is available 48-96 hours after online publication and is updated daily on week days.
Initial download of the metrics may take a while.