Fig. 2
Download original image
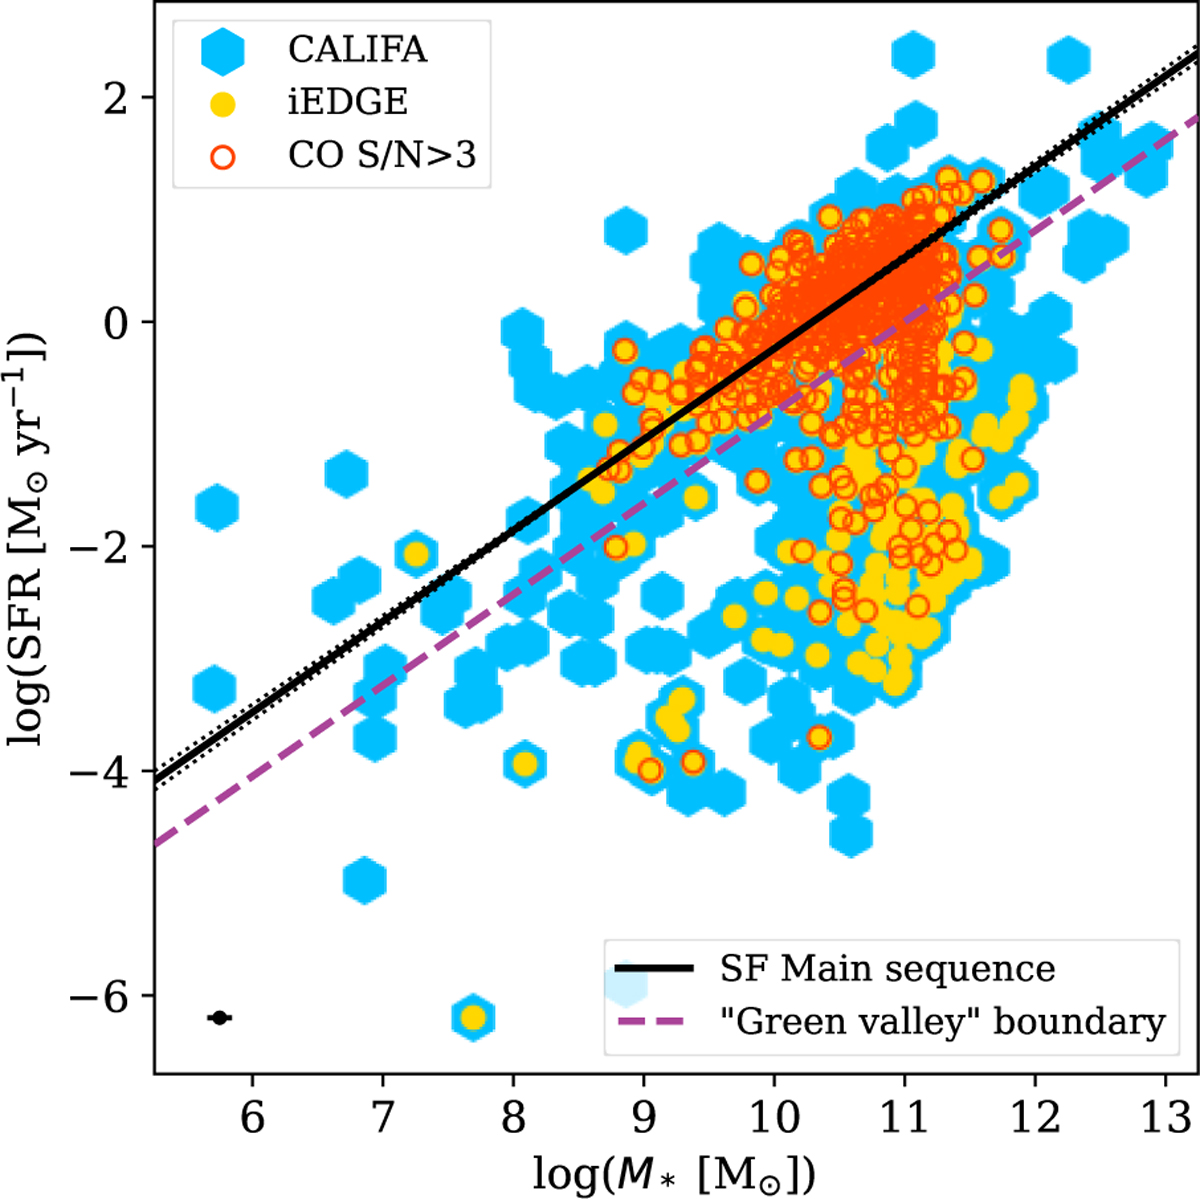
Diagram of SFR-M* showcasing the coverage of iEDGE compared to CALIFA. The full CALIFA sample is shown with blue hexagons, while yellow circles indicate galaxies included in iEDGE. Additionally, red circle marks CO-detected (with S/N>3) objects in iEDGE. The solid black line in both panels represents the SFMS model from Cano-Díaz et al. (2016), with dotted lines showing uncertainties. The dashed purple line marks the “green valley” boundary from C20, positioned at 3σ (0.20 dex, following Cano-Díaz et al. 2016) below the SFMS.
Current usage metrics show cumulative count of Article Views (full-text article views including HTML views, PDF and ePub downloads, according to the available data) and Abstracts Views on Vision4Press platform.
Data correspond to usage on the plateform after 2015. The current usage metrics is available 48-96 hours after online publication and is updated daily on week days.
Initial download of the metrics may take a while.